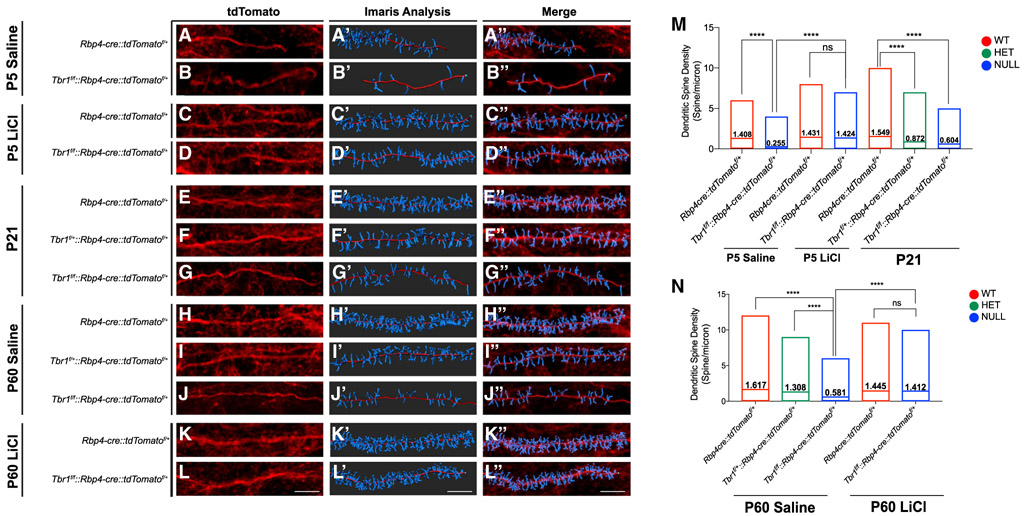
Figure 4. LiCl Rescues Dendritic Spine Density of Tbr1layer5 CKOs.
(A–L″) In (A)–(L), Rbp4-cre∷tdTomatof/+ allele was used to label the dendrites of layer 5 neurons. Imaris software was used to analyze the dendritic spine density on the apical dendrites of Tbr1layer5 WT and Tbr1layer5 CKO neurons located within layers 2–4 of the mPFC (A′–L′). Changes in the dendritic spine density of layer 5 neurons were examined at P5 (A–D), P21 (E–G), and P60 (H–L). (A″–L″) Merged images.
(M) Quantification of dendritic spine density at P5 and P21. Spine density was improved 24 hr after LiCl treatment at P5 in (C) and (D) and P60 in (K) and (L), compared to the saline-injected control animals in (A) and (B) and in (H) and (J).
(N) Quantification of mature dendritic spines of Tbr1layer5 WT and mutant neurons at P60, 24 h after injection with saline (control) or LiCl. Floating bar graphs represent min-max distribution of the dendritic spine density of layer 5 neurons within layers 2–4 of the mPFC. Horizontal line in each box denotes the average spine density. Average mature dendritic spine density is numerically indicated in each box.
****p < 0.0001. ns, not significant. Scale bar, 8 μm.
See also Figure S6.

