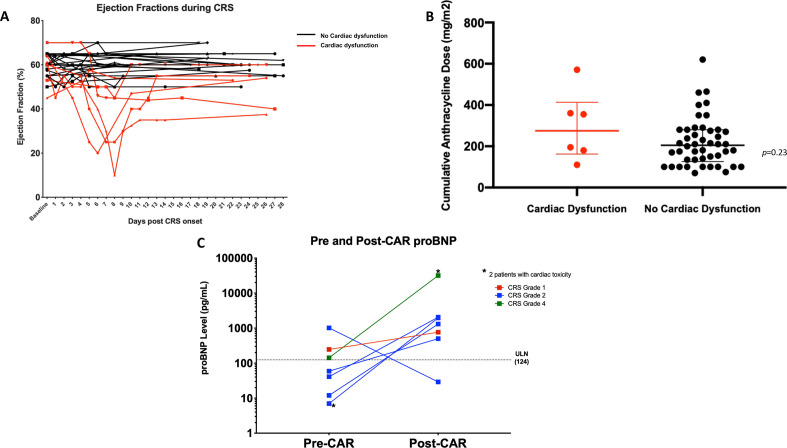
Figure 1.
(A) Left ventricular EF (%) in all patients with CRS. Each line represents a patient’s EF during the course of CRS as determined by echocardiogram. Black lines indicate those patients with CRS who had preserved EF; without cardiac dysfunction. Red lines indicate those patients with CRS who had decreased EF and experienced cardiac dysfunction. (B) Cumulative anthracycline dose for all patients treated on CD19-28ζ CAR T-cell trial stratified by those who had decreased EF (min: 100 mg/m2, max: 570 mg/m2) and those that had preserved EF (min: 70 mg/m2, max: 620 mg/m2) as compared with their baseline echocardiograms. (C) Pre-CAR and Post-CAR T-cell therapy proBNP levels in seven patients. Two patients with the highest post-therapy pro-BNP levels (depicted by the *) had decreased EF and cardiac dysfunction. CAR, chimeric antigen receptor; CRS, cytokine release syndrome; pro-BNP, pro-B-type natriuretic peptide.

