Fig. 1.
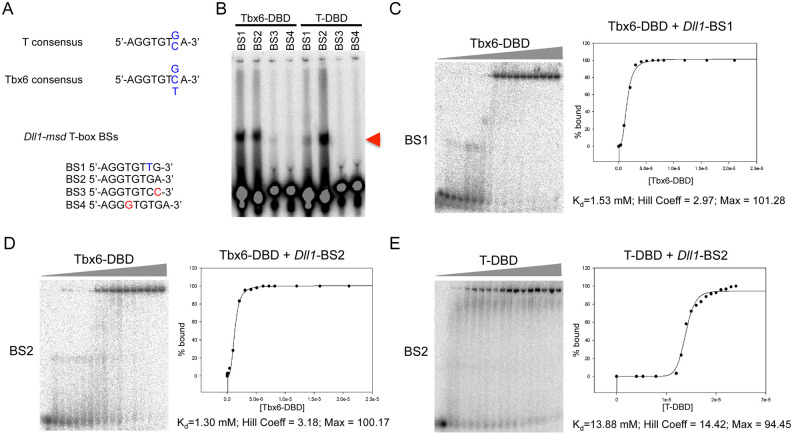
Binding of Tbx6 and T DNA binding domains to the T-box binding sites in the Dll1-msd enhancer. (A) EMSAs using the DBDs of Tbx6 and T and the four T-box binding sites (BS) found in the Dll-msd enhancer. The sequences for the T and Tbx6 consensus BS and the four BSs found in the Dll1-msd enhancer are shown with the variable seventh position in blue and mismatches in red. (B) Arrowhead indicates the shifted radiolabelled DNA. (C–E) Fuji BAS-2500 phosphoimages of quantitative EMSAs using increasing amount of His-Tbx6-DBD (range 0.21 nM–2.1 μM) or T-DBD (range: 4.0 μM–2.4 μM) added to a constant 10 pM of double-stranded labeled oligonucleotide corresponding to Dll1-msd BS1 or BS2. Percentage DNA bound versus concentration of protein was plotted and fitted to a three-parameter Hill equation to determine binding affinity (Kd), Hill co-efficient, and maximum percentage bound (Max).

