Fig. 1.
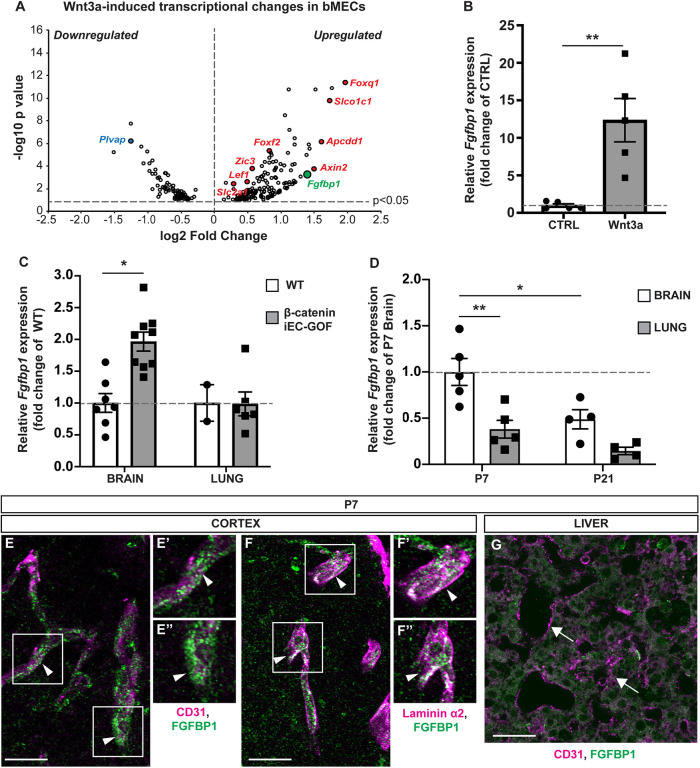
Fgfbp1 is induced by Wnt/β-catenin activation in brain ECs. (A) Volcano plot representing transcriptional changes in Wnt3a-treated versus untreated primary mBECs. Each dot represents a single gene. Only genes with P<0.05 were plotted. Red dots correspond to upregulated genes whereas blue dots correspond to downregulated genes. Fgfbp1 is shown in green. (B) Dotted bar graph of the fold change in Fgfbp1 mRNA expression for Wnt3a-treated versus untreated mBECs. Each dot represents an independent experiment. Data are mean±s.e.m.; n=5; **P<0.005; Student's t-test. (C) Dotted bar graph of the fold change in Fgfbp1 mRNA expression for brain or lung microvessels isolated from P8 WT (n=7 brain; n=2 lungs) and β-cateniniEC-GOF (n=9 brain; n=6 lung) pups. Each dot represents a single animal. Data are mean±s.e.m. *P<0.05; Student's t-test. (D) Dotted bar graph of the fold change in Fgfbp1 mRNA expression in brain and lung microvessels isolated from WT P7 (n=5) and P21 (n=4) pups. Each dot represents a single animal. Data are mean±s.e.m.; *P<0.05, **P<0.005; one-way ANOVA. (E-G) Immunofluorescence for Fgfbp1 in brain (E-F″) and liver (G) vasculature of P7 WT pups. Vessels are marked with CD31 (red), vascular BM with laminin α2 (red) and Fgfbp1 (green). Fgfbp1 levels are very low in liver (G, arrows), but the protein levels are high in brain blood vessels (E-E″, arrowheads), where it colocalizes with laminin α2 (F-F″, arrowheads). E′,E″ and F′,F″ show magnifications of boxed areas in E and F, respectively. Scale bars: 10 µm.

