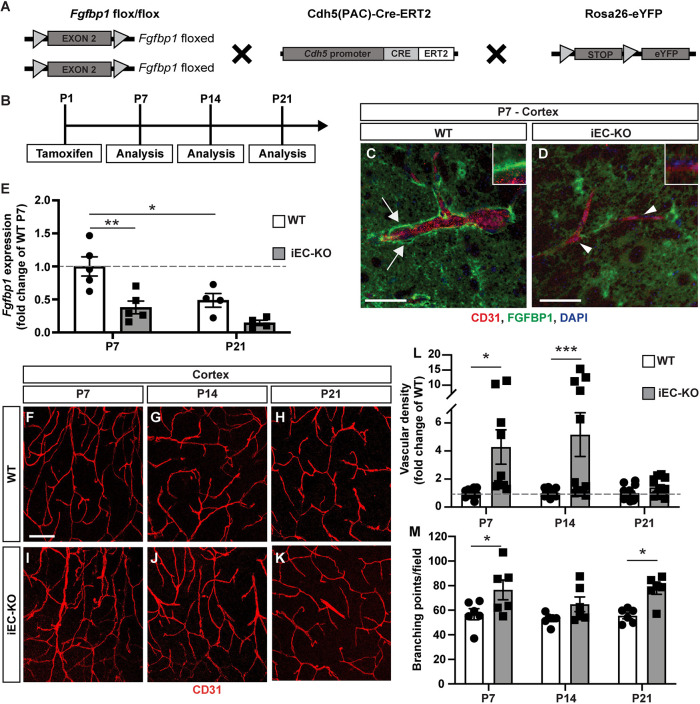
Fig. 2.
Vascular abnormalities in cortices of Fgfbp1iEC-KO mice during postnatal development. (A,B) Diagrams showing the breeding strategy (A) and experimental setup (B) to produce and analyze Fgfbp1iEC-KO mice. (C,D) Immunofluorescence for Fgfbp1 (green), CD31 (red) and DAPI (blue) in 100 µm thick vibratome sections of P7 WT (C) and Fgfbp1iEC-KO (D) brains. Fgfbp1 is expressed at high levels in the vascular BM (C, arrows) in WT brains, but is reduced in Fgfbp1iEC-KO brains (D, arrowheads and insets). Expression of Fgfbp1 protein by neurons or astrocytes is still detected in Fgfbp1iEC-KO mice. (E) Bar graph of fold change in Fgfbp1 mRNA expression for ECs freshly isolated from brains of WT and Fgfbp1iEC-KO P7 and P21 pups. Each dot represents a single animal. Data are mean±s.e.m.; *P<0.05, **P<0.005; one-way ANOVA. Fgfbp1 is significantly reduced in P7 mutant mice. (F-K) Analysis of vascular morphology in the cortex of WT (F-H) and Fgfbp1iEC-KO (I-K) mice at P7 (F,I), P14 (G,J) and P21 (H,K). The vasculature is visualized by immunofluorescence for CD31 (red). (L,M) Quantification of vascular density (L) and branching points (M) in cortices of WT and Fgfbp1iEC-KO mice at P7, P14 and P21. Each dot represents the average of at least three confocal acquisitions from a single animal. The cortical vascular density is increased in Fgfbp1iEC-KO pups at P7 and P14. Data are mean±s.e.m. *P<0.05, ***P<0.0005; Student's t-test. Scale bars: 50 µm in C,D; 100 µm in F-K.

