Fig. 7.
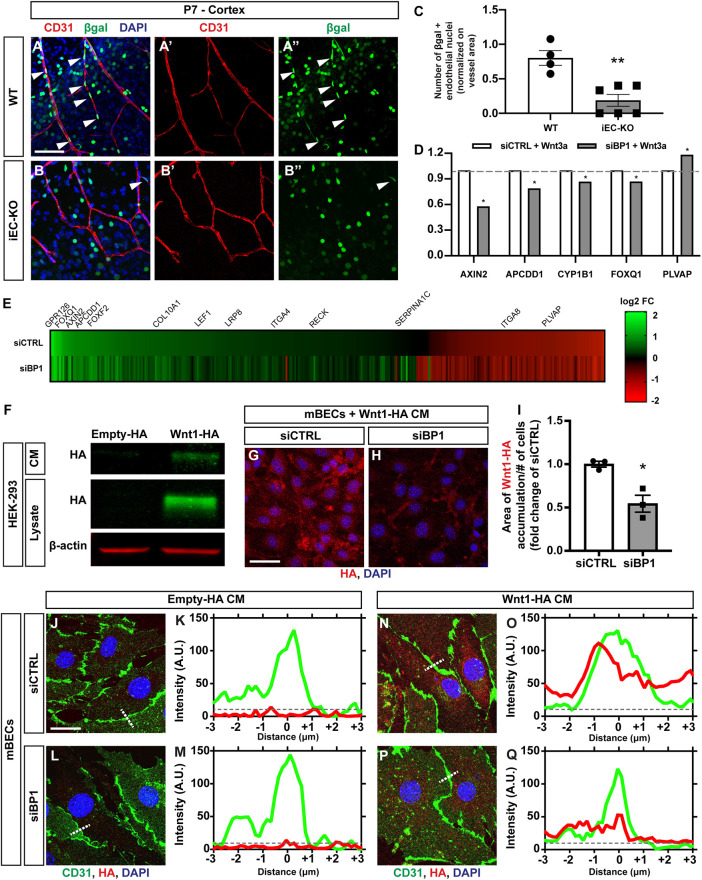
Fgfbp1 regulates Wnt/β-catenin activation in brain ECs by concentrating Wnt ligands near cell junctions. (A-B″) Representative images of cortical vasculature from BAT-lacZ (A) and Fgfbp1iEC-KO/BAT-lacZ (B) reporter mice at P7. Sections (100 µm thick) were stained for CD31 to identify blood vessels (red, A′ and B′) and β-galactosidase (β-gal) to identify cells with transcriptionally active β-catenin (green, A″ and B″). Arrowheads indicate β-gal-positive EC nuclei. (C) Quantification of the number of β-gal-positive EC nuclei in the cortex of WT and Fgfbp1iEC-KO mice crossed to BAT-lacZ at P7. Each dot represents the average of at least three confocal acquisitions from a single animal. Fgfbp1iEC-KO mice show reduced Wnt/β-catenin activity in CNS ECs compared with WT mice. Data are mean±s.e.m. **P<0.005; Student's t-test. (D) Fold changes in mRNA expression of five established Wnt/β-catenin targets upon Wnt3a exposure in siCTRL- or siBP1-transfected mBECs. The data were derived from the Affymetrix analysis of Wnt3a-induced transcriptional changes in siCTRL- and siBP1-transfected mBECs (Table S1). Results are shown as fold change of siBP1 versus siCTRL. The mRNA expression of four genes (Axin2, Apcdd1, Cyp1b1 and Foxq1) is reduced and Plvap is upregulated in siBP1-transfected mBECs in the presence of Wnt3a compared with siCTRL transfected cells. *P<0.05; Student's t-test. Dashed gray line indicates the average fold change in siCTRL-transfected mBECs upon Wnt3a exposure. (E) Heatmap of Wnt3a-induced transcriptional changes in siCTRL- and siBP1-transfected mBECs (Affymetrix). Only genes that show significant (P<0.05) changes after Wnt3a treatment in either siCTRL- or siBP1-transfected cells are reported. Plotted genes are ordered based on decreasing fold-change in expression in Wnt3a-treated versus untreated siCTRL-transfected cells. Upregulated genes are in green and downregulated genes are in red (the intensity is shown in the scale). (F) Western blot analysis of HA tag levels in supernatants (CM) and lysates of HEK293 cells transfected with either empty or Wnt1-HA plasmid. (G,H) Immunofluorescence for HA tag (red) and DAPI (blue) in Wnt3a-treated siCTRL- or siBP1-transfected mBECs after incubation with Wnt1-HA CM for 24 h. (I) Quantification of Wnt1-HA distribution areas in Wnt3a-treated siCTRL- or siBP1-transfected cells after incubation with Wnt1-HA CM. Each dot represents an independent experiment. Wnt1-HA distribution is reduced in siBP1-transfected mBECs compared with siCTRL-transfected cells. Data are mean±s.e.m. *P<0.05; Student's t-test. (J-Q) Representative images (J,L,N,P) and fluorescence intensity plot profiles (K,M,O,Q) for CD31 (green), HA tag (red) and DAPI (blue) in siCTRL- (J,K,N,O) and siBP1-transfected mBECs (L,M,P,Q) after incubation with either control CM (J-M) or Wnt1-HA CM (N-Q). Histograms in K,M,O and Q represent fluorescence intensity profiles along the white dotted lines in J,L,N and P, respectively. Dashed gray line indicates background fluorescence. Scale bars: 100 µm in A,B; 20 µm in G,H; 10 µm in J,L,N,P.

