Fig. 3.
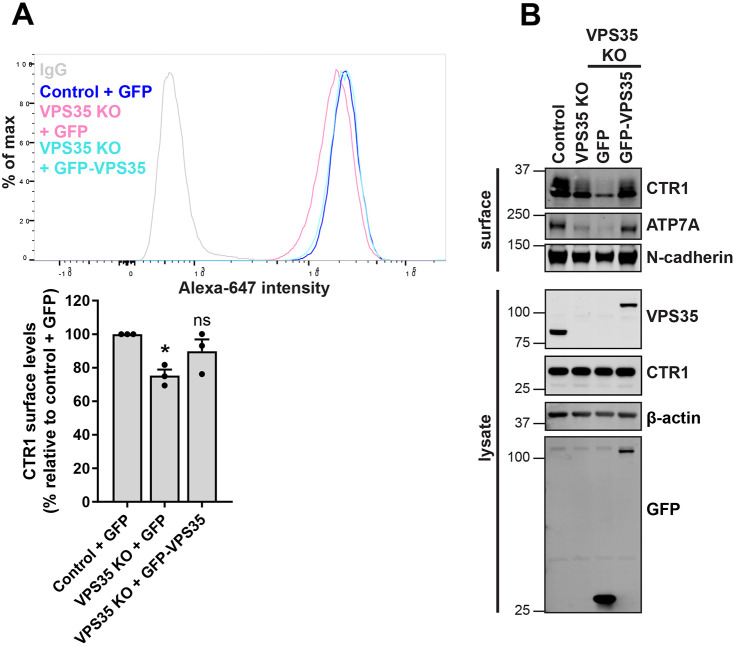
Re-expression of VPS35 rescues cell surface levels of CTR1. (A) Cell surface CTR1 levels were analysed by flow cytometry in control and VPS35 KO HeLa cells transduced with GFP control or GFP–VPS35 as indicated. Quantification represents the change in CTR1 cell surface levels relative to the control cells expressing GFP. The graphs represent means±s.e.m.; n=3 independent experiments. *P<0.05; ns, not significant (one-way ANOVA followed by Dunnett's multiple comparison). (B) Rescue of CTR1 cell surface levels assessed by surface biotinylation. The indicated HeLa cells were surface biotinylated and streptavidin–agarose used to capture biotinylated membrane proteins. Surface abundance of the indicated proteins were examined by immunoblotting.

