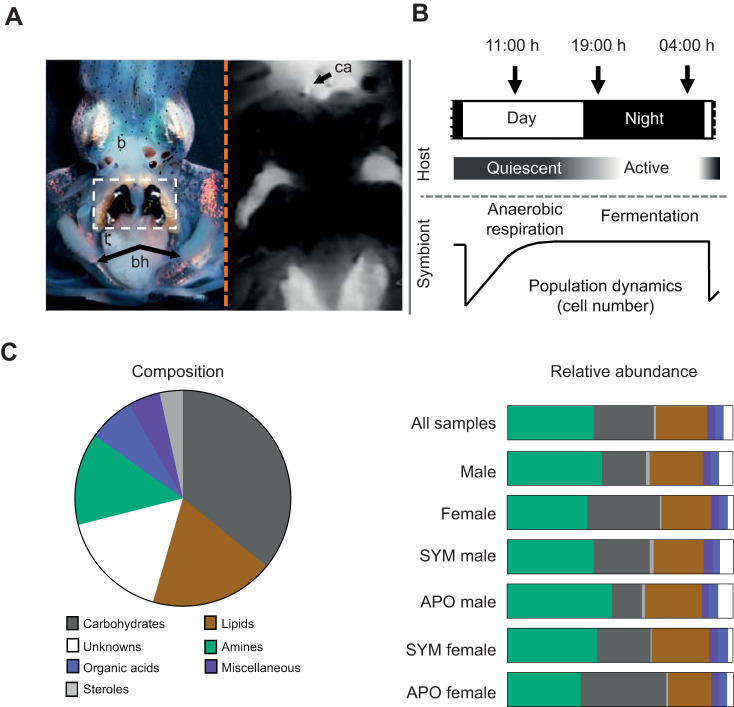
Fig. 1.
The squid–vibrio symbiosis and the composite hemolymph metabolome of the host. (A) Left panel: an adult squid showing the position of the V. fischeri-colonized light organ (white box); b, brain; bh, branchial hearts; t, testes; right panel: vascularization in E. scolopes (image from Nyholm et al., 2009; with permission from Wiley Publishing). The circulatory system was labeled by injection of CellTracker Orange (Molecular Probes, Eugene, OR, USA) into the cephalic aorta (ca). (B) The daily rhythm of the symbiosis. Numbers at the top represent the times of day that hemolymph was drawn from animals over the day–night cycle; features below illustrate the daily cycles of host activity, as well as symbiont metabolism and population dynamics in the organ. (C) Left panel: the complexity of biochemical composition of the hemolymph under all conditions combined, including male/female and all times of day, was conserved; 120/145 (83%) of metabolites were present in every sample (N=33); right panel: representative abundance for each metabolite category; the diagram represents the average total peak areas for each metabolite category as a proportion of the total peak areas within a given host condition (all samples N=33, male N=16, female N=17; SYM male N=8, APO male N=8, SYM female N=8, APO female N=9).

