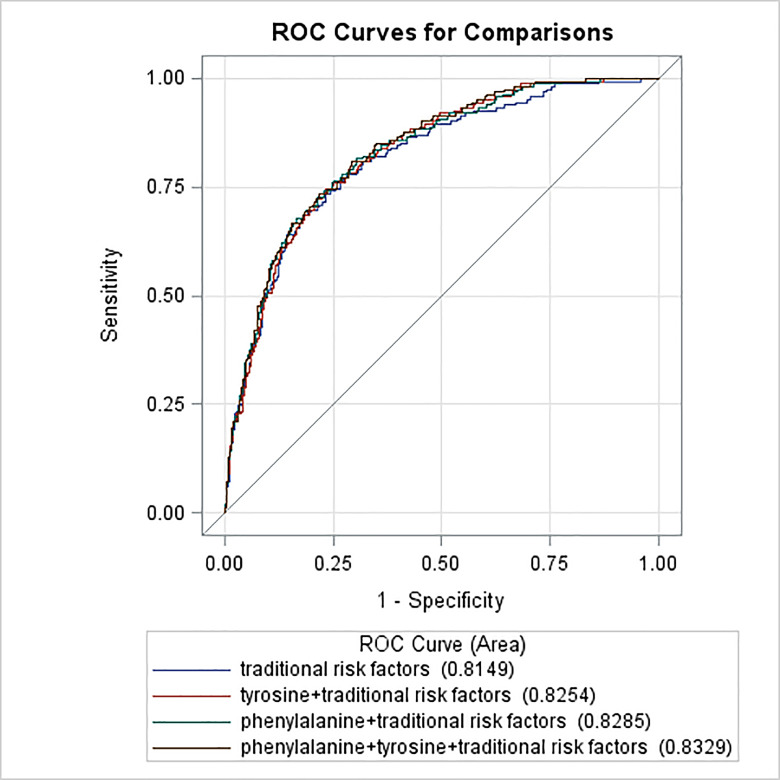
Figure 2.
ROC curves of traditional risk factors and traditional risk factors plus amino acids for diabetic retinopathy in type 2 diabetes. The blue curve stands for the traditional risk factor model (multivariable model 1 in table 2 for the list of variables); the red curve stands for the traditional risk factors plus the tyrosine model; the green curve stands for the traditional risk factors plus the phenylalanine model; the black curve stands for the traditional risk factors plus the phenylalanine and tyrosine models. The area under the operating characteristic curve was 0.81 (95% CI 0.78 to 0.85) for the traditional risk factor model, 0.83 (95% CI 0.79 to 0.86) for the traditional risk factor plus tyrosine model, 0.83 (95% CI 0.80 to 0.86) for the traditional risk factor plus phenylalanine model, 0.83 (95% CI 0.80 to 0.86) for the traditional risk factor plus phenylalanine and tyrosine model (p<0.05 for comparison of the traditional risk factor model with the rest of the three models). ROC, receiver operating characteristic.

