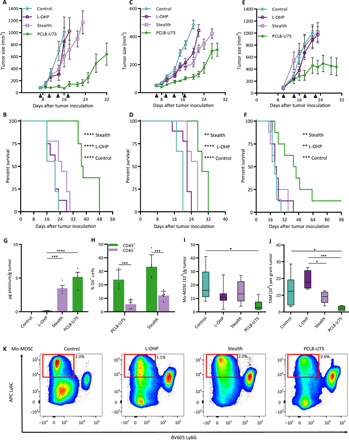
Fig. 3. Effect of L-OHP PCL8-U75 in syngeneic tumor models with high tumor accumulation in leukocytes and depletion of immunosuppressive populations.

Three syngeneic tumor models were treated with L-OHP (8 mg/kg), PCL8-U75 L-OHP, and stealth L-OHP liposomes every 4 days as indicated by arrowheads. Tumor growth curves are shown as mean tumor size ± SEM. Tumor growth curve and Kaplan-Meier plots of B16.F10 tumors on C57BL/6JRj (A and B), orthotopic inoculated 4T1 tumors on Balb/cJRj mice (C and D), and CT26 tumors on Balb/cJRj mice (E and F). Median survival time of PCL8-U75 L-OHP–treated groups was significantly improved compared to L-OHP stealth, free L-OHP, and untreated controls across all tumor models (**P < 0.005 and ****P < 0.0001). n = 8 to 10. (G) Tumor levels of platinum were investigated 48 hours after the second treatment with L-OHP PCL8-U75, stealth L-OHP, or free L-OHP. The platinum levels were significantly higher for both stealth- and PCL8-U75 liposome–treated tumors (***P < 0.001 and ****P < 0.0001). n = 3 to 5. (H) Bar plot showing the association of CD45+ and CD45− populations and the DiI signal. Both liposome formulations were stably formulated with DiI and L-OHP, and the association in immune cells was analyzed 24 hours after intravenous injection of L-OHP (8 mg/kg). The percentage of DiI+ cells from the leukocytic CD45+ or cancer cell CD45− (fscmid sscmid) populations is shown as means and SEM (***P < 0.001). n = 5. CT26 TME analysis by flow cytometry and the count per gram of tumor of Mo-MDSCs (I) and TAMs (J) was performed 48 hours after the third treatment with L-OHP PCL8-U75, L-OHP stealth, L-OHP, or untreated controls. (I) Mo-MDSCs (CD11b+ CD11c− Ly6Chi Ly6Glo) cells were significantly lower in the PCL8-U75 L-OHP group (P < 0.05). n = 6 to 10. (J) PCL8-U75 depletes TAM in the TME compared to free L-OHP and stealth L-OHP (*P < 0.05 and ***P < 0.001). n = 6, mean and SEM are shown. (K) Representative pseudocolor plots from CT26 tumor samples. Parent gate is the CD45+ CD11b+ CD11c− population, and the red gate shows the Ly6Chi-defined Mo-MDSCs. The number indicated is the percent of scatter gate.
