
Fig. 2. CpG-P-ss-M elicits antigen-specific CD8+ CTL response by improving the LDIMP process.
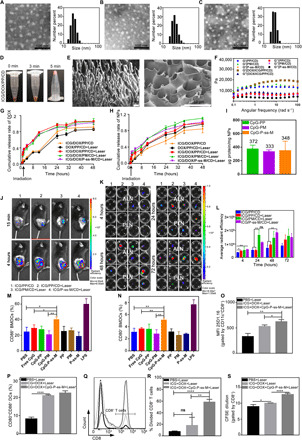
(A to C) TEM images and DLS analysis of CpG-PP (A), CpG-PM (B), and CpG-P-ss-M (C). (D) Photograph of gelation process after ultrasonication. (E) Scanning electron microscopy images of PP/CD gel. (F) Frequency-dependent rheological properties of gels. (G and H) Cumulative release rate of DOX (G) and nanoparticles (NPs) (H) upon irradiation. (I) Quantification of proteins captured by nanoparticles. (J) Live images of melanoma-bearing mice after intratumoral administration. Red circles, location of subiliac LNs. (K) Ex vivo imaging of popliteal and axillary LNs collected at different times after administration. (L) Semiquantitative data of fluorescence signal from popliteal, sciatic, axillary, and accessory axillary LNs. (M and N) Percentages of CD86+ (M) and CD80+ (N) BMDCs gated by CD11c+. (O) Mean fluorecent intensity (MFI) of 25D1.16 signal gated by CD11c+CD8+ and (P) percentages of CD80+CD86+ gated by CD11c+ in BMDCs/B16-OVA multicellular spheroid cocultured system. (Q to S) Percentages of CD8+CTLs (Q and R) and CFSE dilution (S) in CD8+ T/BMDCs/B16-OVA multicellular spheroid cocultured system. *P < 0.05, **P < 0.01, ****P < 0.0001. ns, not significant. Error bars represent mean ± SD; n = 3. Photo credit (D): Lin Qin, West China School of Pharmacy, Sichuan University.