
Fig. 3. Antitumor effects in the bilateral B16F10 tumor model.
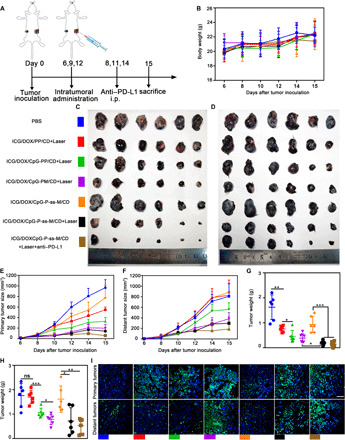
(A) Schematic depicting the experimental approach. (B) Body weight of B16F10 tumor–bearing mice (n = 6). (C and D) Representative images of primary (C) and distant tumors (D) after treatment. (E and F) Primary (E) and distant (F) tumor size curves (n = 6). (G and H) Weight of primary (G) and distant tumors (H). (I) TUNEL staining of primary and distant tumors; scale bar, 50 μm. *P < 0.05, **P < 0.01, ***P < 0.001. Error bars represent mean ± SD. Photo credit (C and D): Lin Qin, West China School of Pharmacy, Sichuan University.