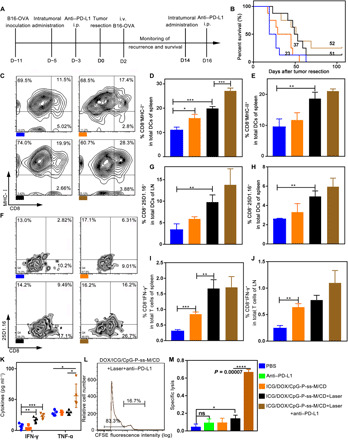
Fig. 5. Combinatorial therapy suppresses postoperative tumor relapse.

(A) Schematic diagram of the postoperative model and the administration schedule. i.p. intraperitoneal; i.v., intravenous. (B) Survival curve of each group using the log-rank (Mantel-Cox) test (n = 8). (C to E) Percentages of CD8+MHC-I+ cells (C and D) and CD8+MHC-II+ cells (E) in total CD11c+ DCs in spleens (n = 3). (F to H) The percentage of CD8+ 25D1.16+ gated on CD11c+ in LNs (F and G) and spleens (H) was detected by flow cytometry (n = 3). (I and J) Percentages of CD8+IFN-γ+ cells in spleen (I) and LN (J) (n = 3). (K) IFN-γ and TNF-α levels in serum measured by ELISA kit (n = 4). (L and M) In vivo CTL response (n = 3). *P < 0.05, **P < 0.01, ***P < 0.001, ****P < 0.0001. Error bars represent mean ± SD.
