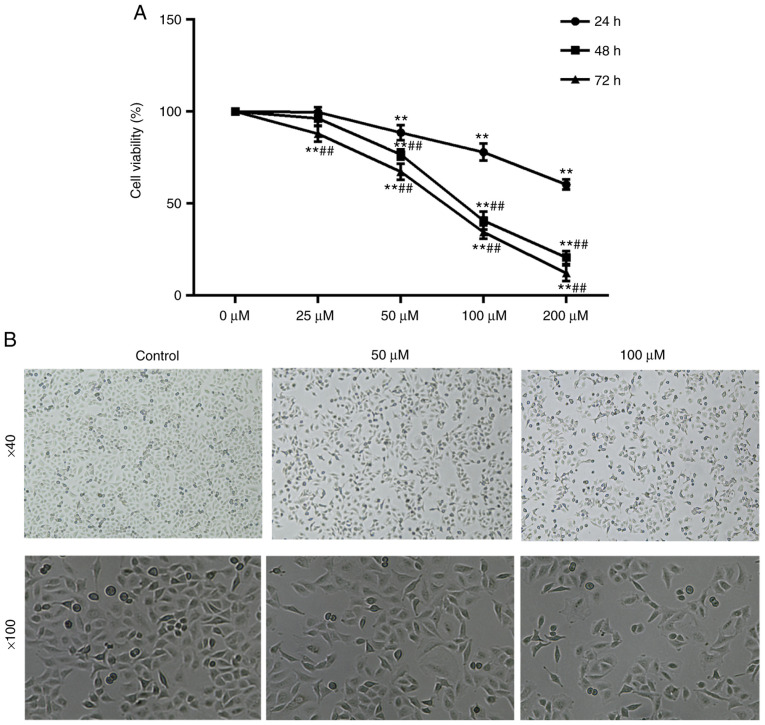
Figure 3.
RSV-induced growth inhibition and morphological features of A549 cells. (A) A549 cells were treated with various concentrations of RSV for various periods of time and were assessed by MTT assay. **P<0.01 vs. 0 µM; ##P<0.01 vs. 24 h. A one-way ANOVA followed by a Tukey's test was used to compare the data. (B) A549 cells treated with various concentrations of RSV for 48 h were observed under an inverted microscope. Magnification, ×40 and ×100. RSV, resveratrol.

