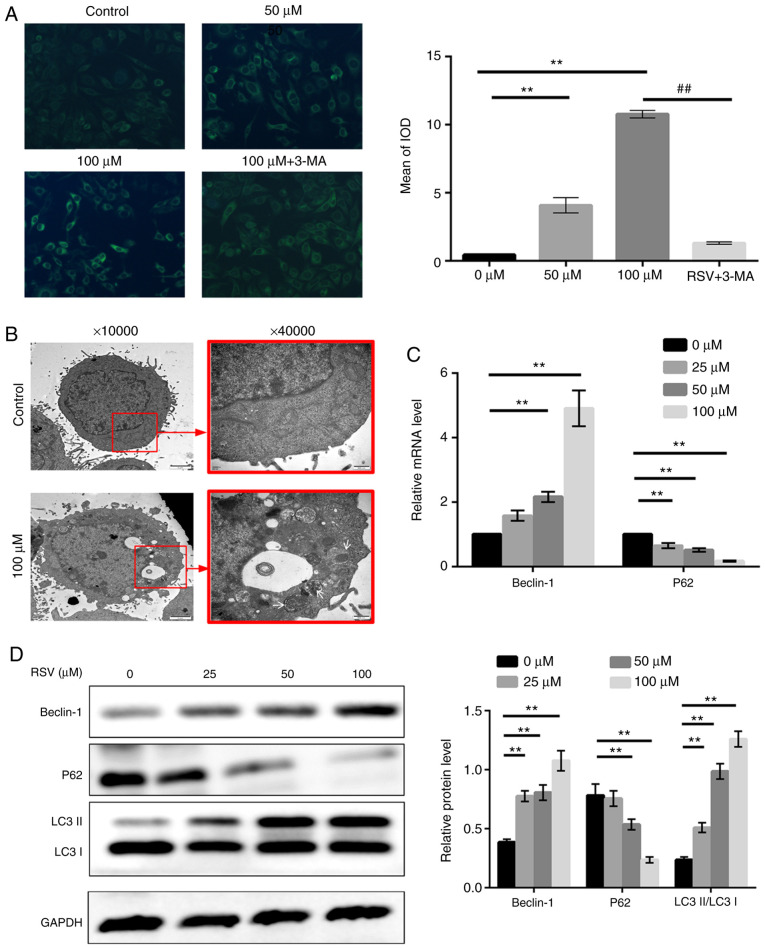
Figure 5.
RSV induces autophagy of A549 cells. (A) A549 cells treated with 0, 50 or 100 µM RSV for 48 h, or pre-treated with 3-MA (5 mM) for 1 h followed by 100 µM RSV treatment for a further 48 h were stained with MDC, and observed under an inverted fluorescence microscope. Magnification, ×100. Fluorescence particles were quantified and compared using the mean of the IOD. (B) A549 cells were cultured with or without 100 µM RSV for 48 h and observed under a transmission electron microscope. Magnification, ×10,000 and ×40,000). White arrows indicate the autophagosomes. (C) A549 cells were treated with various concentrations of RSV for 48 h and the Beclin-1 and P62 mRNA expression levels were determined. (D) A549 cells were treated with various concentrations of RSV for 48 h and the LC3-II/LC3-I, Beclin-1 and p62 protein expression levels were detected by western blot analysis. A one-way ANOVA followed by a Dunnett's multiple comparison t-test or Tukey's test was used to compare the data. **P<0.01 vs. 0 µM; ##P<0.01 vs. 100 µM + 3-MA. RSV, resveratrol; MDC, monodansylcadaverine; IOD, integrated optical density; 3-MA, 3-methyladenine.

