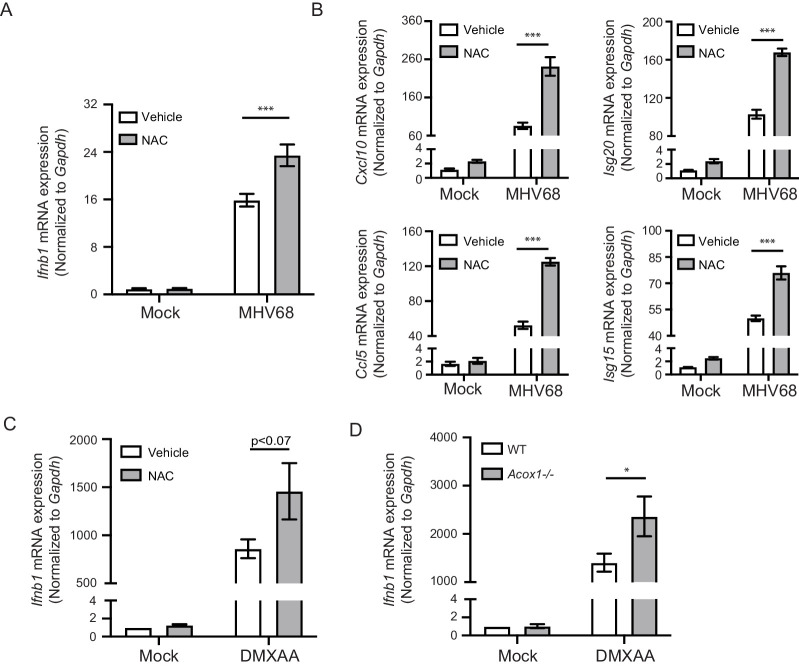
Figure 3. Endogenous ROS regulate interferon response upon STING activation.
(A, B) BMDMs were treated with 2 mM NAC for 30 min, then infected with MHV68 at MOI = 5. Transcripts of Ifnb (A) or ISGs (Cxcl10, Isg20, Ccl5, Isg15) (B) were determined 6 hr after infection. n = 6. (C) BMDMs were treated with 2 mM NAC for 30 min, then stimulated with 1 μg/ml DMXAA. Transcripts of Ifnb were determined 2 hr after stimulation. n = 4. (D) BMDMs isolated from Acox1-/- or WT littermate control were stimulated with 1 μg/ml DMXAA. Transcripts of Ifnb were determined 2 hr after stimulation. n = 4. Data are shown as mean ± SE, statistical analysis was conducted using two-way ANOVA followed by Tukey’s multiple comparison test, only the p value for the most relevant comparisons are shown for simplicity. *, p<0.05, **, p<0.01, ***, p<0.001.


