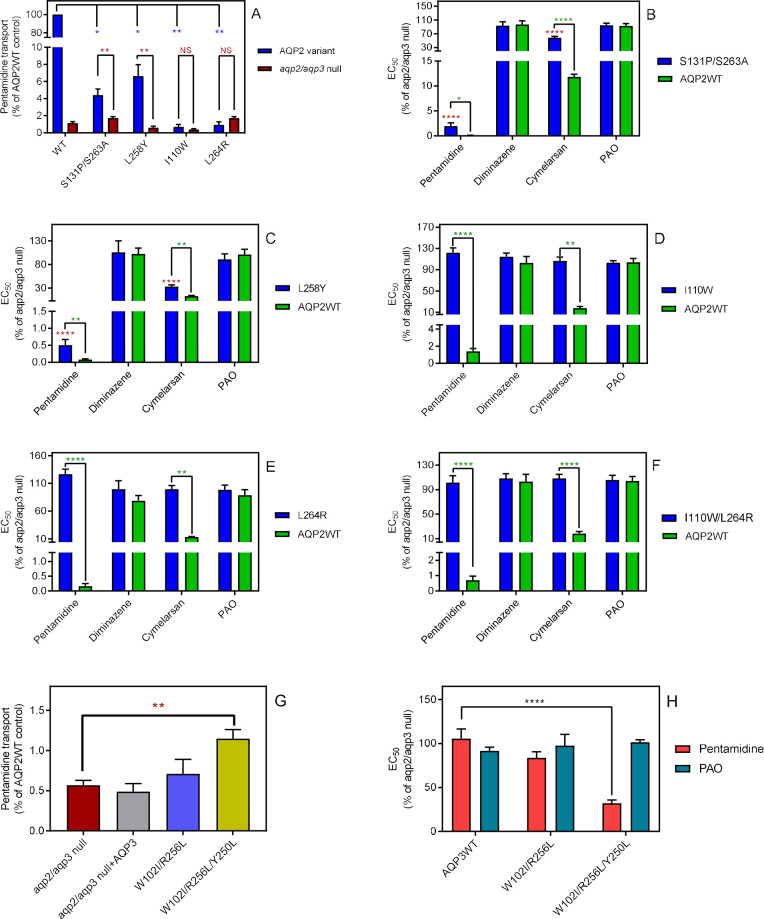
Figure 2. The selectivity filter differences between TbAQP2 and TbAQP3 are largely responsible for their differences in pentamidine sensitivity and transport rates.
(A) Transport of 30 nM [3H]-pentamidine by tbaqp2/aqp3 null cells expressing TbAQP2-WT or one of the TbAQP2 mutants as indicated (blue bars). The corresponding brown bars are pentamidine transport in the control tbaqp2/aqp3 null cells assessed in parallel in each experiment. Transport was determined in the presence of 1 mM adenosine to block the TbAT1/P2 transporter. Bars represent the average and SEM of at least three independent experiments, each performed in triplicate. Blue stars: statistical significance comparison, by two-tailed unpaired Student’s tests, between the cells expressing TbAQP2WT and mutants; red stars: statistical comparison between the AQP2-expressing cells and control cells; NS, not significant. (B–F) EC50 values indicated test drugs, expressed as a percentage of the resistant control (tbaqp2/tbaqp3 null), against cell lines either expressing the indicated TbAQP2 mutant or TbAQP2WT (sensitive control). Red stars and green stars: comparison with tbaqp2/aqp3 null or TbAQP2WT-expressing cells, respectively, which were always assessed in parallel in each experiment. (G) Transport of 30 nM [3H]-pentamidine by tbaqp2/aqp3 null cells expressing TbAQP3 or an AQP3 mutant as indicated. (H) EC50 values of the indicated drugs against tbaqp2/aqp3 null cells expressing either TbAQP3 or a mutant thereof, expressed as percentage of tbaqp2/aqp3 null. All data for these graphs are contained in Figure 2—source data 1. All experiments are the average and SEM of at least three independent experiments. *, p<0.05; **, p<0.01; ***, p<0.001, ****, p<0.0001 by unpaired Student’s t-test, two-tailed.

