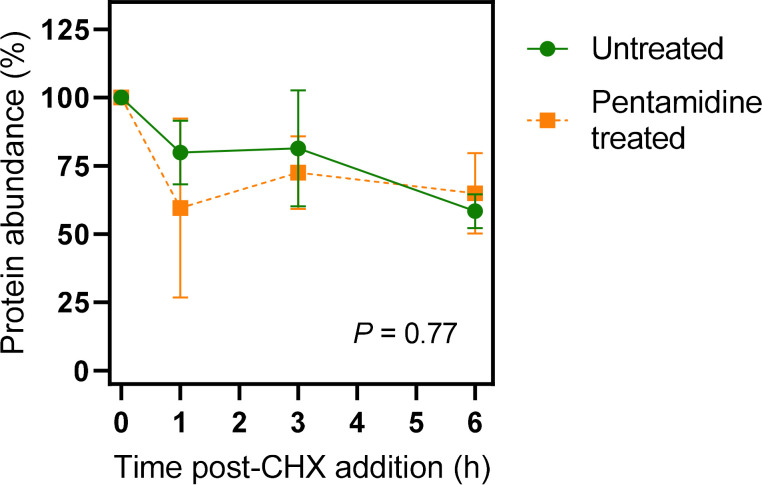
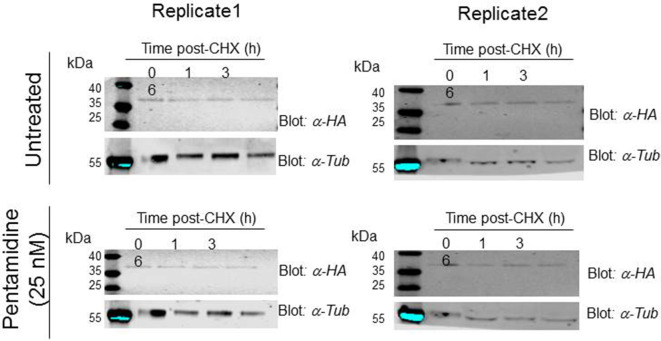
Figure 6. Quantification of western blots of 3×HATbAQP2.
Cells were induced for expression of 3×HATbAQP2, pretreated with cyclohexidine and subsequently with 25 nM pentamidine (5× EC50). Western blots (Figure 6—figure supplement 1) were performed using anti-HA antiserum in order to quantify the relative amount of TbAQP2 in the cells. The two datasets were not significantly different by Kolmogorov-Smirnov test (p=0.77) and data points at each time point were also not significantly different by Student’s t-test (p>0.05). All data for these graphs are contained in Figure 6—source data 1.


