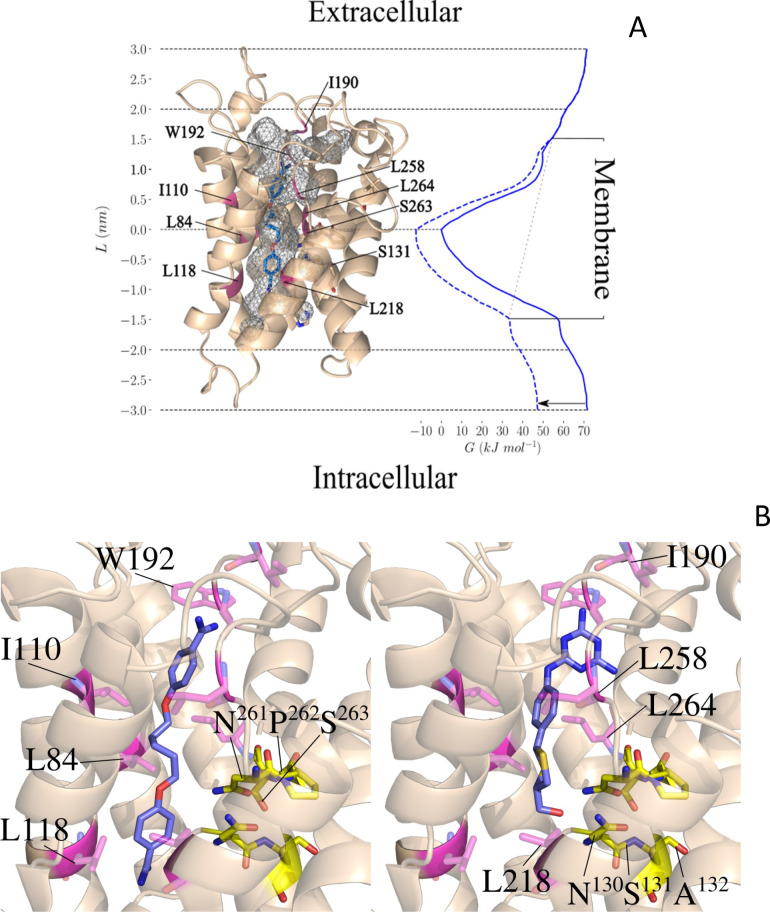
Figure 8. Pentamidine binding in TbAQP2 and free-energy profile of permeation (Left).
(A) Docked conformation of pentamidine (blue) bound to the TbAQP2 (wheat). The protein and the ligand were modelled as described.4 The protein pore is shown in grey mesh, and the mutated positions described in the text are in magenta. (Right) Free-energy profile G(L) (solid blue line) along the pore axis of TbAQP2 (L). The membrane voltage of T. b. brucei gives rise to a voltage drop across the membrane (gray dotted line), which alters the free-energy profile (dashed blue line includes Vm effect) and reduces the free-energy of pentamidine exit into the intracellular bulk by ~22 kJ/mol as compared to the extracellular side (black arrow). (B) Close-up views comparing the bound positions of pentamidine (left) and melarsoprol (right) and showing the mutated sites and major interactions with the AQP2 pore lining.


