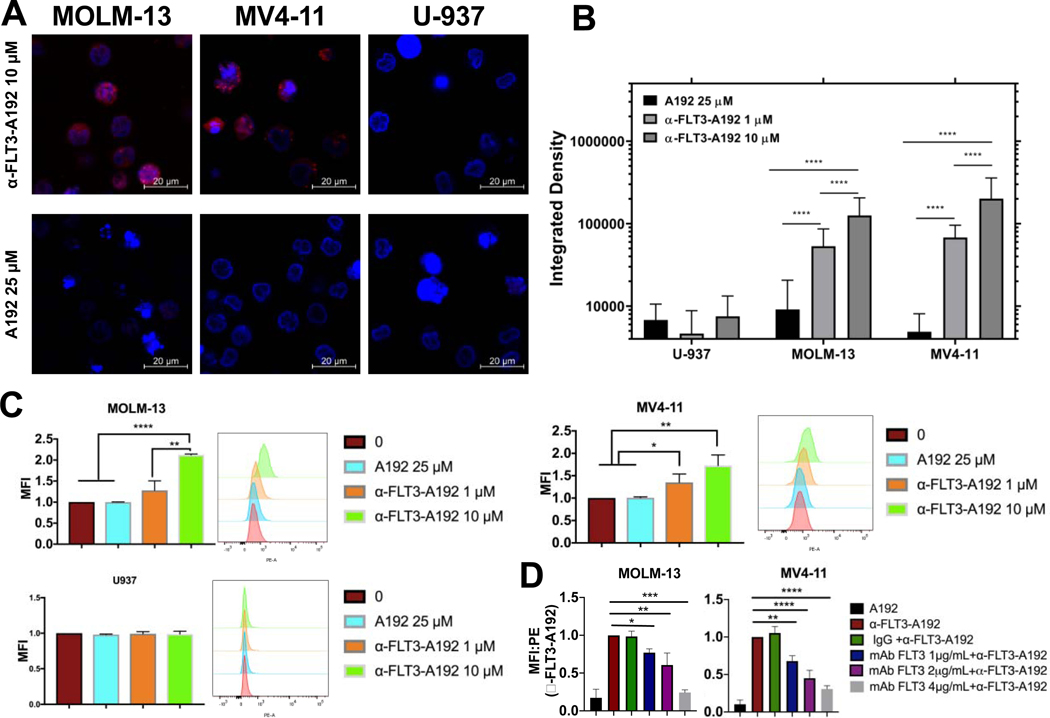
Figure 3. Recombinant α-FLT3-A192 binds to FLT3 receptor tyrosine kinase.
FLT3 ITD+ AML cell lines MOLM-13 and MV4–11 and FLT3 negative U937 cells (0.5 × 10⁶ cells each) were treated with 1 μM or 10 μM of rhodamine labeled α-FLT3-A192 or 25 μM of rhodamine labeled A192 for 30 minutes on ice. Binding was only observed in MOLM-13 and MV4–11 via A) Laser scanning confocal microscopy. B) Cell fluorescence was quantified with ImageJ by analyzing images obtained from laser scanning confocal microscopy. Higher fluorescence signal was observed in cells treated with 10 μM α-FLT3-A192 compared with 1 μM. (U-937, n=35, 56, 20; MOLM-13, n=203, 70, 84; MV4–11, n=76, 62, 24) C) Binding of rhodamine labeled α-FLT3-A192 to MV4–11 and MOLM-13 cells was confirmed via flow cytometry by measuring peak shift in rhodamine to bounds cells and quantifying based on mean fluorescence imaging. No binding was observed in U937 cells (FLT3 negative). A rhodamine-labeled A192 control failed to bind to any of the cell lines. D) Competitive binding assay was performed in MOLM-13 and MV4–11 cells by pre-treating cells with either anti-FLT3mAb (1, 2, 4 μg/mL) or IgG and then observing binding with rhodamine α-FLT3-A192 (10 μM). Binding was measured via Flow cytometry by measuring the peak shift in rhodamine to bound cell and quantifying based on mean fluorescence intensity. MFI was normalized to cells treated with α-FLT3-A192 alone. Data represented as mean ± SD, n=3. * p≤0.05 ** p≤0.01*** p≤0.001**** p≤0.0001

