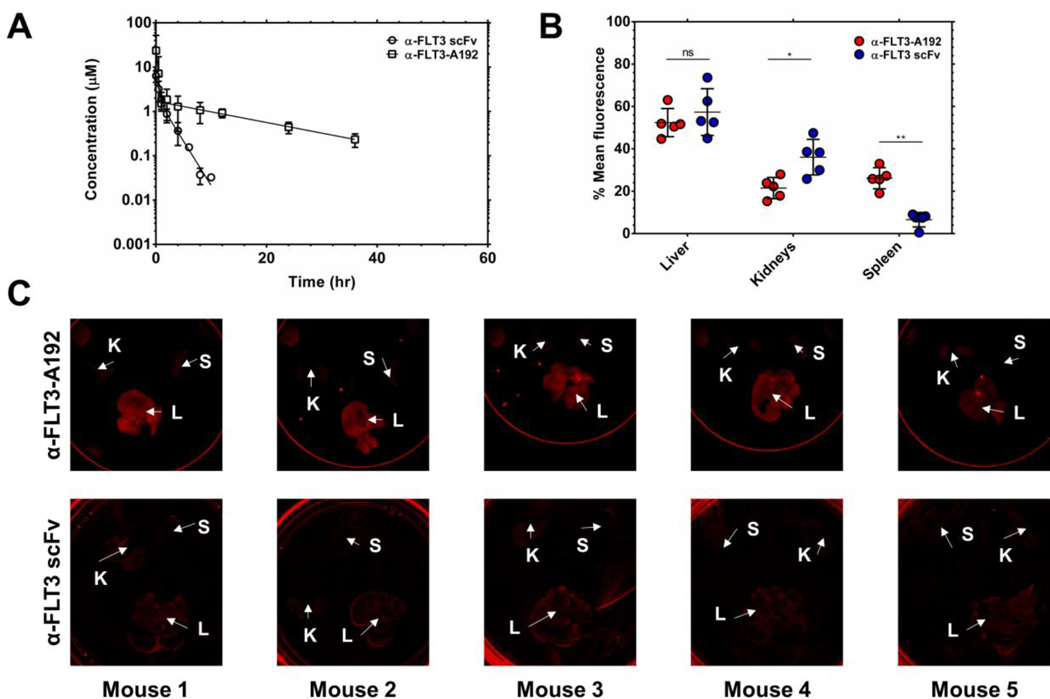
Figure 6. The pharmacokinetic terminal half-life of α-FLT3-A192 nanoparticles exceed that of a control α-FLT3 scFv:
220 μM of rhodamine-labeled α-FLT3-A192 and 110 μM of α-FLT3 scFv in PBS was injected via the tail vein to mice (n=5) in 150 μl/25g B.W. Plasma was collected and measured for fluorescence. Rhodamine-labeled α-FLT3-A192 and α-FLT3 scFv concentrations were calculated using a standard curve. As quality control, plasma samples were all analyzed by SDS-PAGE to determine what fraction of total fluorescence remained associated with the intact, labeled protein (Fig. S4). A) The plasma concentrations were fit to Eq. 7 to obtain the PK curve, and the generated curve shows rhodamine-labeled α-FLT3-A192 and α-FLT3 scFv concentration in the plasma over time. After 96 hours from the injection, spleen, kidneys, and liver were collected from mice treated with rhodamine-labeled α-FLT3-A192. B-C) IVIS images (α-FLT3-A192) and iBright images (α-FLT scFv) of organs were obtained 96 hours post-injection and quantified based on the mean fluorescence measured from images using ImageJ. The fraction of total mean fluorescence (the sum of mean fluorescence of the liver, kidneys, and spleen) was calculated for each organ (Eq. 6), and the % mean fluorescence was plotted to compare the relative accumulation in major clearance organs was plotted. The accumulation of α-FLT3-A192 in the liver was not significantly different from that of α-FLT3 scFv (p>0.05). On the other hand, the accumulation of α-FLT3-A192 in the kidneys was significantly lower than that of α-FLT3 scFv (p≤0.05). In contrast, accumulation of α-FLT3-A192 in the spleen was significantly higher than that of α-FLT3 scFv (p≤0.01).

