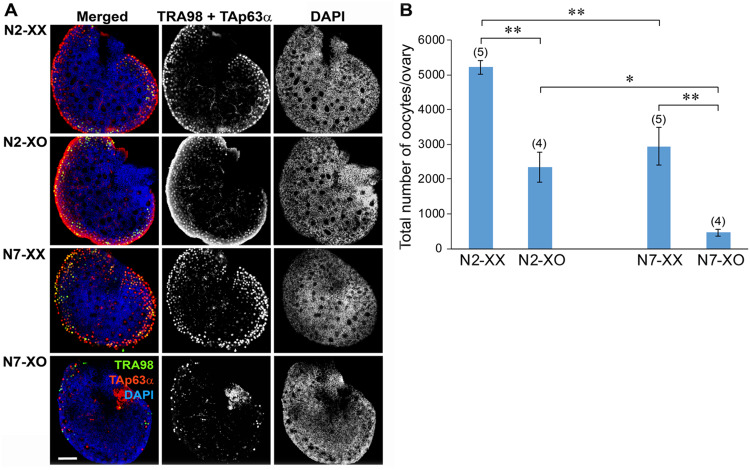
Figure 2.
Number and distribution of oocytes in the XX and XO ovaries of N2 and N7 generations at 4 days after birth. (A) Immunofluorescence staining of wholemount ovaries. Merged images are followed by staining of germ cell markers (TRA98 and TAp63α) or nuclear staining with DAPI alone. Note the absence of oocytes in the central region and fewer oocytes in the peripheral region in the N7-XO ovary compared to other types of ovaries. (B) Total number of oocytes per ovary. Mean ± SEM. The number of ovaries examined is shown in parentheses above each column. * and ** indicate significant differences at P < 0.05 and 0.01, respectively, by Sidak’s multiple comparison test.

