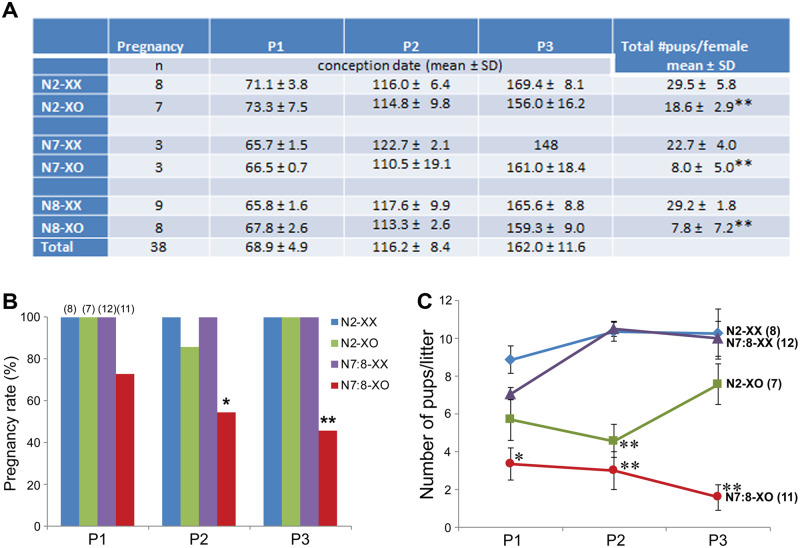
Figure 4.
Fertility of adult XX and XO females in N2 and N7-N8 generations. (A) Pregnancy age ranges and the total number of pups delivered by each female. **Significant difference from XX females of the same generation at P < 0.001 by Student’s t-test. (B) Percentage of females which became pregnant and delivered pups in three reproductive age ranges. * and ** indicate significant differences in N7:8-XO females compared to N7:8-XX females at P < 0.05 and 0.01, respectively, by Fisher’s exact test. (C) Number of pups per litter. Mean ± SEM. * and ** indicate significant differences from other females at P < 0.05 and 0.01, respectively, by two-way ANOVA (genotype and ages) followed by Tukey’s multiple comparisons test.

