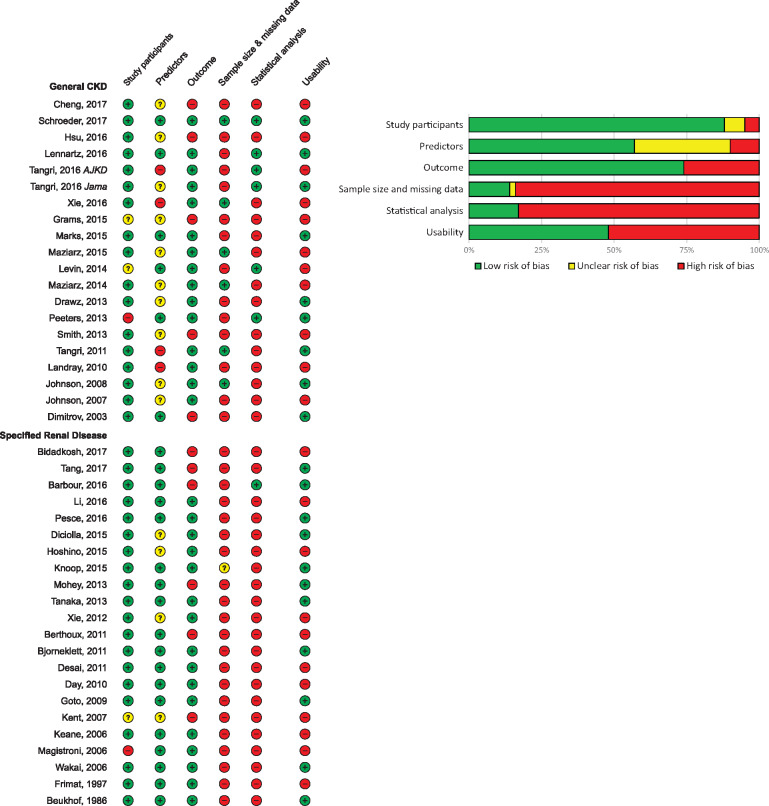
FIGURE 4.
(A) Risk of bias and usability of prediction models (N = 42). Assessed using the PROBAST. The five risk of bias domains were evaluated as low risk (+), unclear risk (?) or high risk (−). Usability was evaluated as yes (+) or no (−). (B) PROBAST risk of bias summary for all studies (N = 42).

