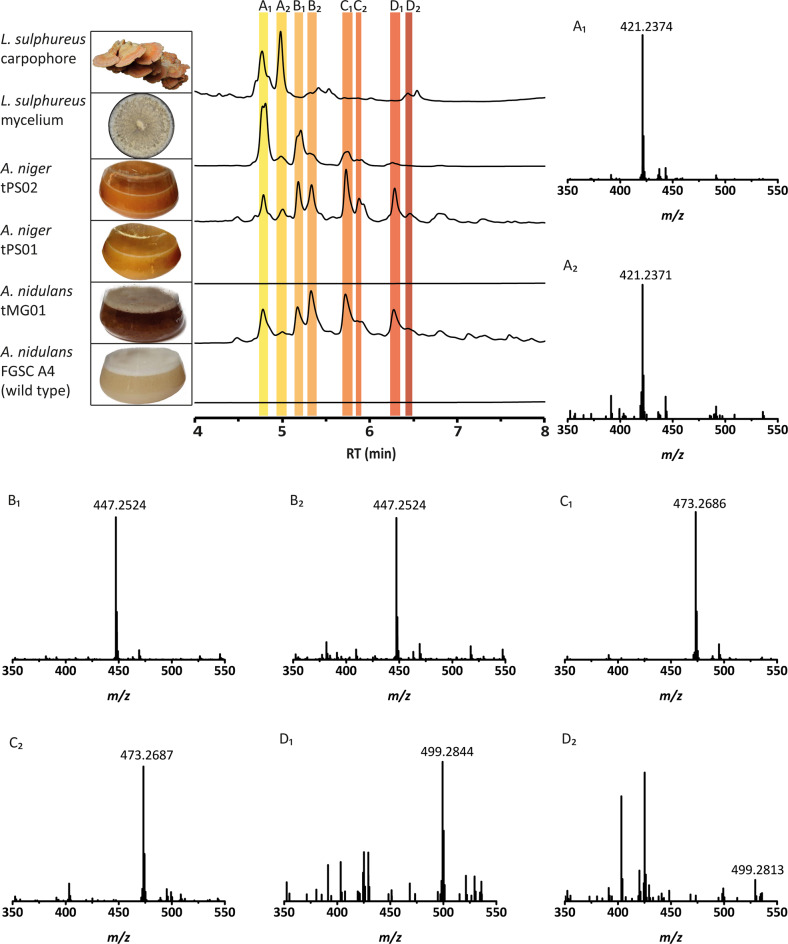
Fig. 3.
UHPLC profiles of metabolic extracts from cultures of L. sulphureus, lpaA-expressing Aspergillus strains and their respective control strains. Representative pictures of the fruiting bodies or cultures are presented (left). UHPLC profiles (top to bottom) of methanolic extracts from L. sulphureus carpophores, vegetative mycelium of L. sulphureus, A. niger tPS02 (lpaA-expressing), A. niger tPS01 (vector control), A. nidulans tMG01 (lpaA-expressing) and A. nidulans FGSC4 wildtype strain. Peaks for laetiporic acids A1–D2 are indicated by colored bars. Chromatograms were extracted at λ = 450 nm. Minor UV-absorbing compounds surrounding laetiporic acids A1–D2 are present that have not been identified, but were absent in the controls. Respective high-resolution mass spectra are given for laetiporic acids A1–D2 purified from A. niger. Polyene peak intensities of mass spectra range between 6 × 10⁵ (LA-D2) and 1.8 × 10⁷ (LA-B1). Please refer to Table 1 for MS² data. LA-D2 was produced in insufficient quantities for further analysis

