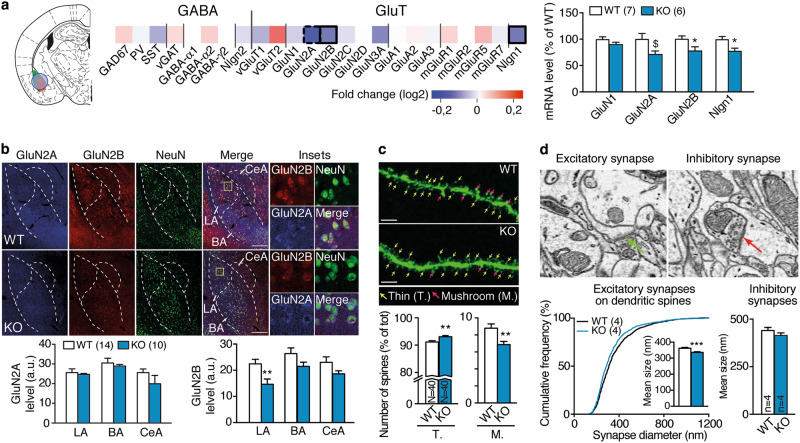
Fig. 2.
Neurobiological alterations in the lateral amygdala induced by St8sia2 deficiency. a Heatmap representation of GABAergic and glutamatergic (GluT) gene markers in the amygdala of St8sia2−/− (KO) mice relative to wild-type (WT) levels (bordered squares represent significant differences, the doted one represent a trend; labeling refers to the protein expressed by the related gene). On the left, the location of the punch is represented. Quantification of mRNA levels of genes with altered expression is provided on the right panel (unpaired t-tests, t11 = 2.064, p = 0.063 for GluN2A; t11 = 2.28, p = 0.043 for GluN2B; t11 = 2.45, p = 0.037 for Nlgn1). b Representative pictures of immunostaining (top, showing GluN2A (blue), GluN2B (red), and NeuN (green)), and corresponding quantification (bottom) in amygdala of St8sia2−/− and WT mice (LA lateral, BA basal, CeA central amygdala) (unpaired t-test, t22 = 2.932, p = 0.0077 for LA). Scale bars, 100 µm. c Representative images of GFP-labeled neurons of WT (top) and St8sia2−/− (bottom), with thin (T.) and mushroom-like (M.) spines identified by color-coded arrows, and quantification (n = 4 mice per genotype, N = 40 segments of neuron per genotype, unpaired t-test, t78 = 3.054, p = 0.0031 for thin; t78 = 3.054, p = 0.0031 for mushroom-like spines). d Representative image of electron microscopy of an excitatory/asymmetric spine on the left and a symmetric/inhibitory synapse on the right (arrows point the synaptic cleft). Graphs, quantification of the distribution of the size of excitatory synapses (left, Kolmogorov–Smirnov test on cumulative distributions, D = 0.089, p < 0.001, and Mann–Whitney test on mean size values, U = 815239, p < 0.0001, n = 4 mice per genotype, N = 1229–1484 synapses) and of the size of inhibitory synapses (right, Mann–Whitney test, U = 17376, p = 0.11, n = 4 mice per genotype, N = 191-201 synapses) in lateral amygdala of St8sia2−/− and wild-type (WT) mice. Results are given as mean ± SEM. $p = 0.06, *p < 0.05; **p < 0.01; ***p < 0.001 vs. WT

