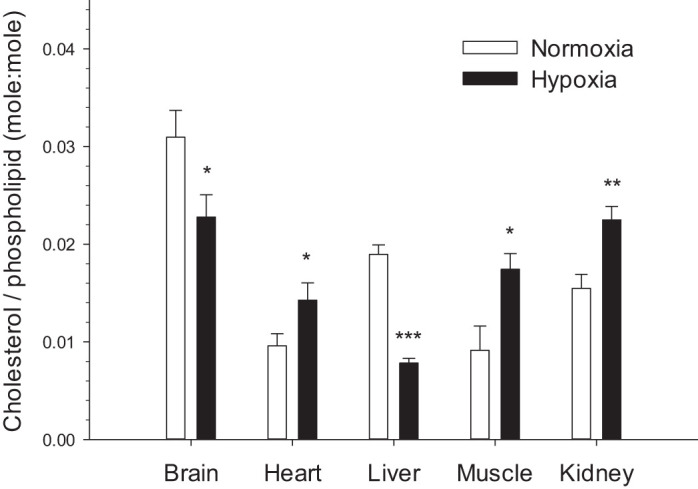
Fig. 4.

Relative membrane cholesterol levels in the tissues of normoxic controls and hypoxia-acclimated naked mole-rats. Values are means ± SE (n = 12 mole-rats in normoxia and n = 9 mole-rats in hypoxia). *P < 0.05, **P < 0.01, and ***P < 0.001, significant effects of hypoxia.
