Fig. 2.
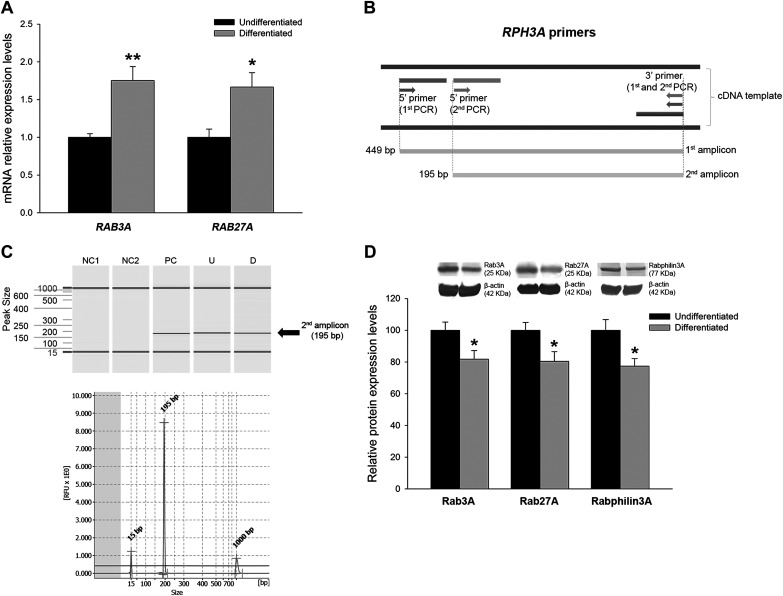
Analysis of Rab GTPases in differentiated podocytes. A: relative mRNA expression levels of RAB3A and RAB27A genes at differentiation stages compared with undifferentiated cells. B: Rabphilin3A gene (RPH3A) primer sets for seminested PCR experiments. C: capillary electrophoresis software capture of fragments belonging to the second PCR amplicon of RPH3A. The images show clear bands and peaks without any other fragment contamination. D: protein levels of Rab3A, Rab27A, and Rabphilin3A in differentiated podocytes compared with undifferentiated podocytes. Data are expressed as means ± SE; n = 8 each group. mRNA levels were normalized to two housekeeping genes, and relative expression was expressed as fold changes, calculated by the following equation: (where Ct is threshold cycle); undifferentiated group values were set to one-fold. Protein levels were previously normalized to β-actin and expressed as arbitrary units; undifferentiated group values were set to 100. NC1, negative control of the first PCR; NC2, negative control of the second PCR; PC, positive control neuronal cell line; U, undifferentiated podocyte; D, differentiated podocyte; RFU, relative fluorescence units. *P < 0.05 and **P < 0.01 vs. the undifferentiated group.

