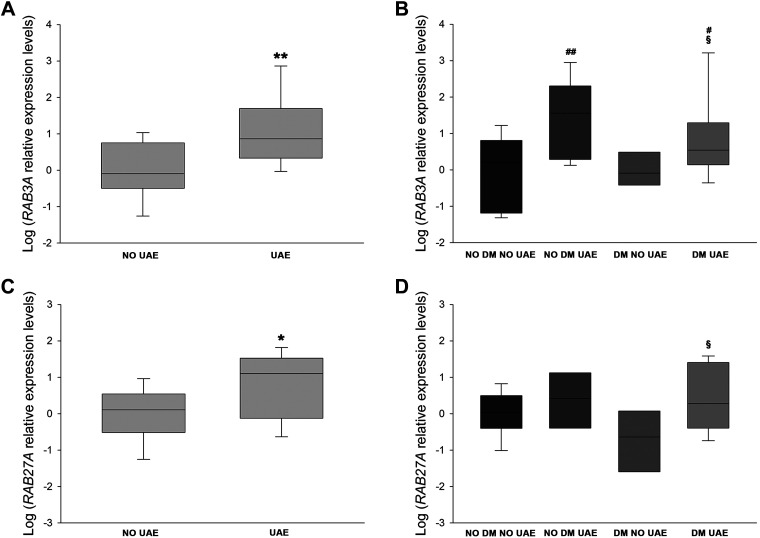
Fig. 6.
Urinary levels of Rab GTPases in patients with hypertension. A and B: box plots of mRNA levels of RAB3A in patients with hypertension with (n = 34) and without (n = 30) increased urinary albumin excretion (UAE; A) or divided into four groups (B). C and D: box plots of mRNA expression levels of RAB27A in patients with hypertension with (n = 34) and without (n = 30) increased UAE (C) or divided into four groups (D). Horizontal lines represent medians ± SE. mRNA levels were normalized to two housekeeping genes, , and relative expression was expressed as fold changes, calculated by the following equation: (where Ct is cycle threshold). DM, diabetes mellitus. *P < 0.05 and **P < 0.01 vs. the no UAE group; #P < 0.05 and ##P < 0.01 vs. the no DM, no UAE group; §P < 0.05 vs. the DM, no UAE group.

