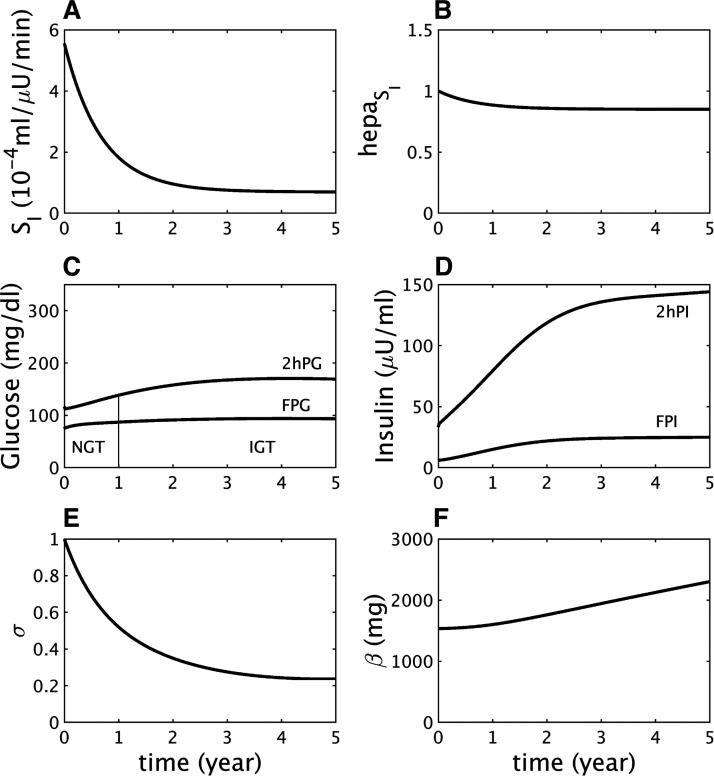
Fig. 2.
Insulin resistance (same as Fig. 1) does not lead to diabetes if beta-cell function is sufficiently responsive. The γ-dynamics is made stronger than in Fig. 1 by decreasing γs (Eq. A15) to 90 mg/dL from 100 mg/dL (see other parameters in Supplemental Table S12A). A: assumed severe decline in peripheral insulin sensitivity (SI). B: assumed mild decline in hepatic insulin sensitivity (). C: simulated longitudinal changes in fasting plasma glucose (FPG) and 2 h glucose (2hPG) during oral glucose tolerance tests (OGTTs) performed at each time point. The virtual subject experiences modest rises in glucose and crosses the threshold for impaired glucose tolerance (IGT) but never crosses the thresholds for impaired fasting glucose, combined glucose impairment, or type 2 diabetes. NGT, normal glucose tolerance. D: simulated longitudinal changes in fasting plasma insulin (FPI) and 2 h insulin (2hPI) during the OGTTs. Insulin concentration increases and saturates but never declines. E: the β-cell function component σ first decreases but then levels off. F: increase in the β-cell function component represented by γ (not shown) helps limit the rise in glucose, which allows the β-cell mass β to increase gradually throughout.

