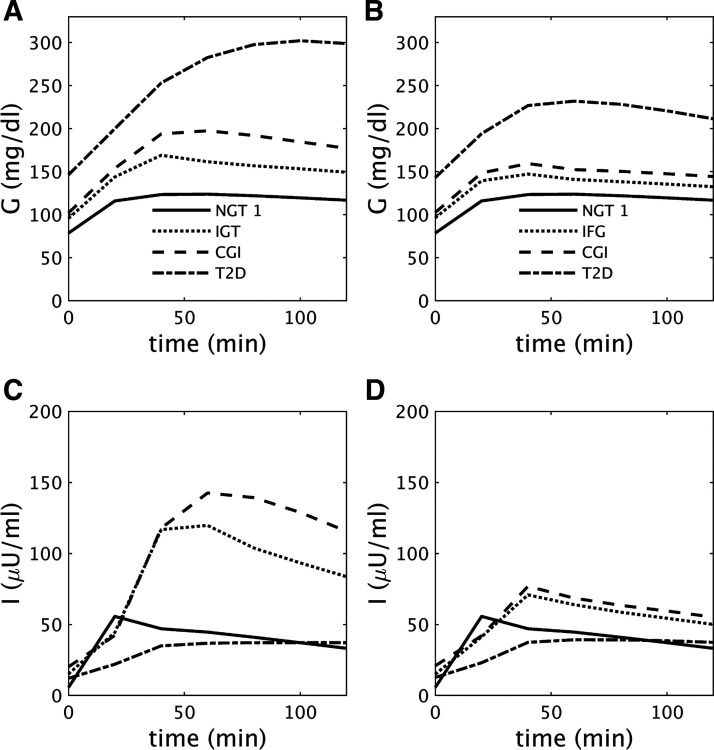
Fig. 6.
A and B: glucose (G) during oral glucose tolerance tests (OGTTs) performed at the times indicated by the black dots in Fig. 1C [A; impaired glucose tolerance (IGT)-first pathway] and Fig. 3C [B; impaired fasting glucose (IFG)-first pathway]. C and D: insulin (I) corresponding to A and B, respectively. See text for details. CGI, combined glucose impairment; NGT, normal glucose tolerance; T2D, type 2 diabetes.

