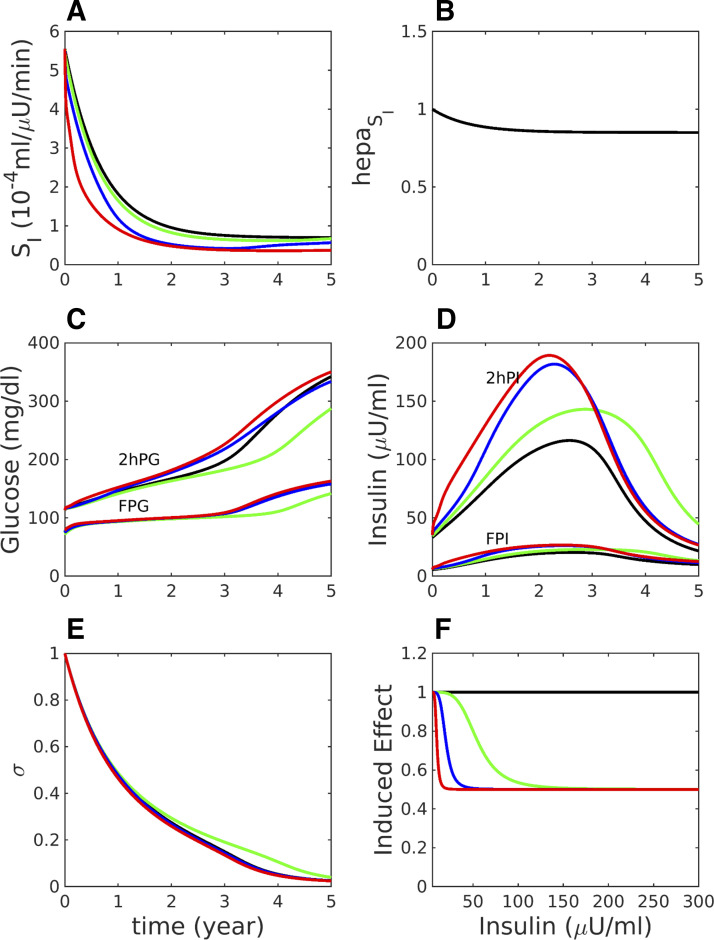
Fig. 9.
Effects on peripheral insulin sensitivity (A), hepatic insulin sensitivity (B), fasting and 2 h glucose during OGTTs (C), fasting and 2 h insulin during OGTTs (D), and beta-cell function (E) of insulin clearance and insulin-induced insulin resistance plotted in F. The case of Fig. 1 [impaired glucose tolerance (IGT) first] is resimulated with varying rates of insulin clearance and induced insulin resistance, defined by Eqs. 13–16. A: SI = SI,0E, where SI,0 is calculated as in Fig. 1 and E is the induced effect plotted in F. Black (control), same as Fig. 1 but with insulin clearance k = 0.4861 min−1, essentially no induced effect (αE = 300 μU/ml); green, reduced clearance (k = 0.37499 min−1), modest induced effect (αE = 50 μU/ml); blue, k = 0.37499 min−1, stronger induced effect (αE = 15 μU/ml); red, k = 0.37499 min−1, very strong induced effect (αE = 5 μU/ml). Other parameters are listed in Supplemental Table S17. FPG, fasting plasma glucose; FPI, fasting plasma insulin; 2hPG, 2 h glucose; 2hPI, 2 h plasma insulin.

