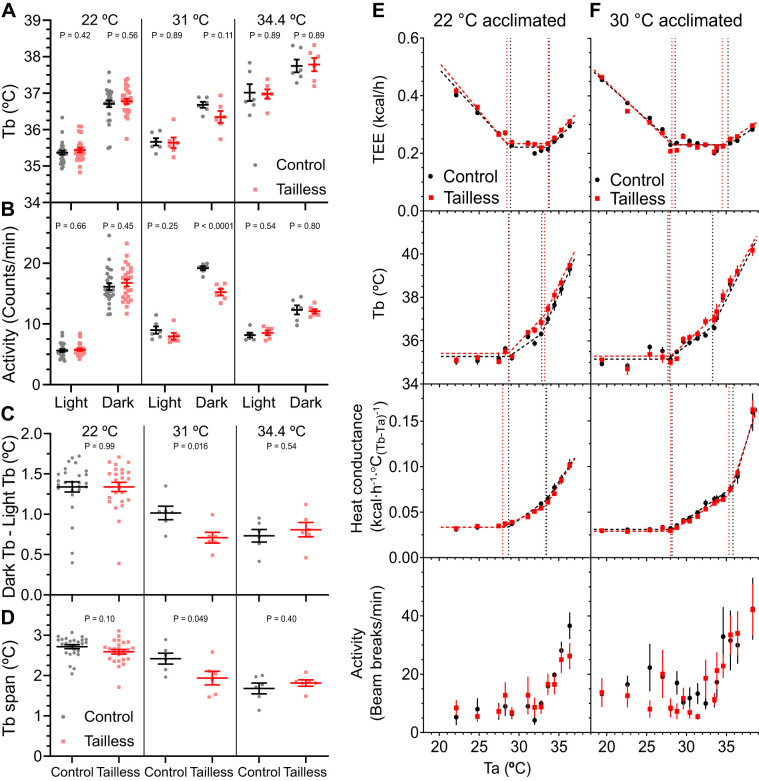
Fig. 2.
Effect of ambient temperature (Ta) on tailless mice. Light and dark phase core body temperature (Tb) and physical activity (A and B), difference between dark and light Tb (C), and Tb span (the 95th minus the 5th percentile) (D) in male control and tailless mice. Tb and activity were monitored continuously by telemetry for 72 h in singly housed mice at Ta of 22, 31, or 34.4°C, as indicated. Data are means ± SE, n = 6–26 mice/group (male). E and F: control and tailless mice previously housed at 22°C or 30°C for 10 days were acclimated to indirect calorimetry chambers for 2 days and then exposed to a range of Ta. Total energy expenditure (TEE), Tb, and heat conductance were analyzed by mixed model segmented regression (see materials and methods and Ref. 44). For visual clarity, only Ta plateau mean ± SE data points are depicted; however, all data were included in the regression models. Complete regression results are in Table 3.

