Fig. 3.
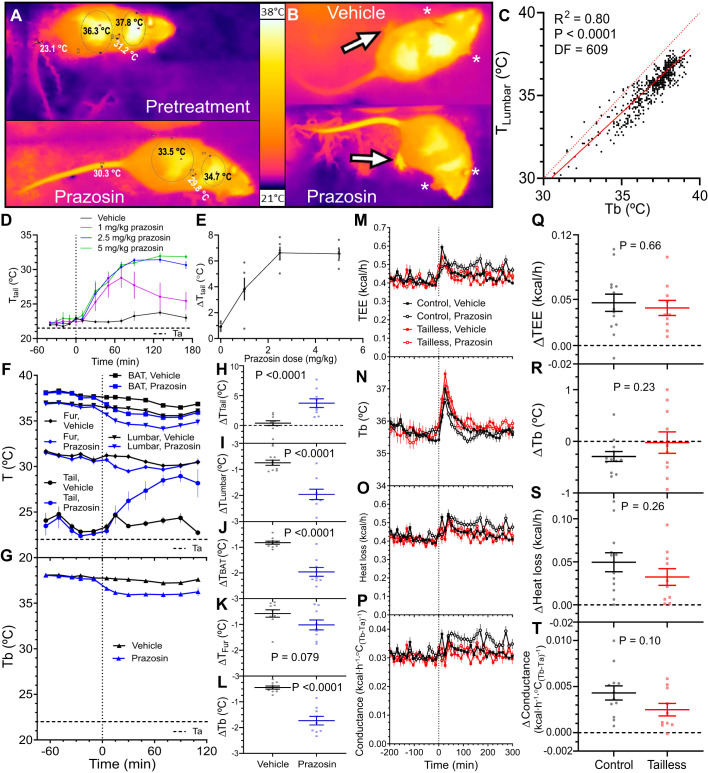
Prazosin-induced vasodilation increases heat loss. A: infrared thermography (IR) of a mouse pretreatment (top) or 70 min after prazosin (bottom). Skin surface temperature measurements are on the tail (1 cm from base, TTail), shaved lumbar (TLumbar), and interscapular (TBAT) areas and unshaved fur (TFur) between the TLumbar and TBAT areas. B: IR images 70 min after treatment with prazosin or vehicle (water). Prazosin increased temperature of the feet (arrows) but not the ears (asterisks). C: correlation between TLumbar and intraperitoneal temperature (Tb) measured concurrently. Solid line is regression TLumbar = (0.88 ± 0.02)Tb + (3.31 ± 0.65), R2 = 0.80, df = 608, n = 14 mice (mixed sex). Dotted reference line is TLumbar = Tb. D: TTail after treatment with the indicated doses of prazosin, n = 5 mice (mixed sex). E: prazosin dose response. ΔTTail is the change from baseline, calculated as TTail mean of 10 to 170 min minus TTail mean of −40 to −10 min, (treatment10to170 – baseline−40to−10). F and G: effect of prazosin on TTail, TLumbar, TBAT, TFur, and Tb in control mice. The 22°C ambient temperature (Ta) is indicated, n = 9 or 10 mice/group (mixed sex). H–L: drug effect was calculated as the change from baseline (treatment5to110 – baseline−65to−10). Prazosin and vehicle effect were compared by unpaired t test. M–T: effect of prazosin on total energy expenditure (TEE), Tb, heat loss, and heat conductance of control and tailless mice. Drug effect was calculated as the vehicle-corrected change from baseline [(prazosin60to180 – prazosin−150to−30) – (vehicle60to180 – vehicle−150to−30)]. n = 10–13 mice/group (male). Data are means ± SE, compared by unpaired t test. Prazosin dose was 2.5 mg/kg, ip, except in dose response.

