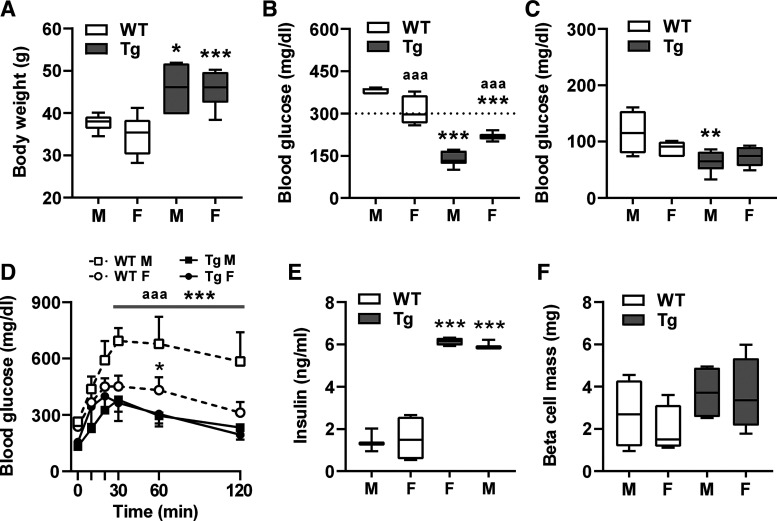
Fig. 4.
Sex differences upon 20-wk high-fat diet (HFD). Data of week 20 from Fig. 3 after separation of males (M) and females (F). A: body weight. B: nonfasting blood glucose. C: ip insulin tolerance tests (IpITT) values at 30-min postinsulin injection. D: ip glucose tolerance tests (IpGTT). E: nonfasting basal serum insulin levels. F: β-cell mass. Data are means ± SD (D) or box plots with min/max whiskers. *P < 0.05, **P < 0.01, and ***P < 0.001 [wild-type (WT) vs. corresponding transgenic (Tg) gender]; aaaP < 0.001 (M vs. F).

