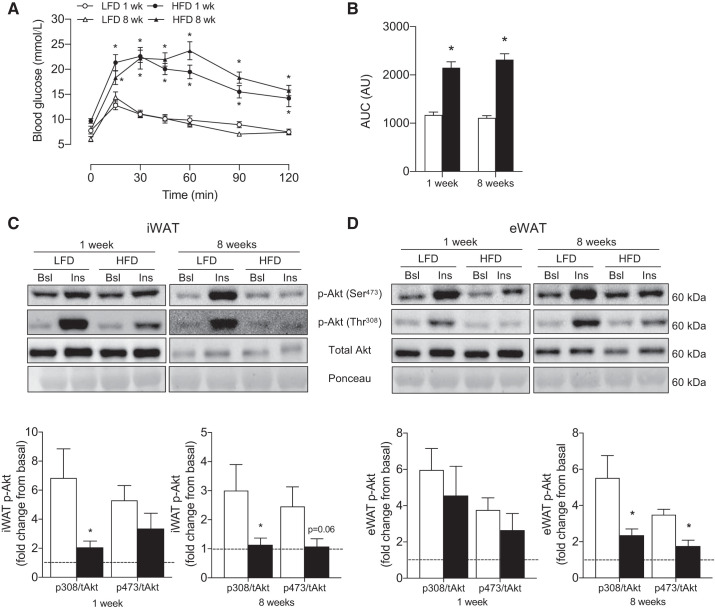
Fig. 1.
Effects of 1 and 8 wk of HFD on whole body glucose homeostasis and white adipose tissue depot-specific insulin signaling. GTT (A), AUC (B), insulin-stimulated phosphorylated Akt fold change from basal in iWAT (C) and eWAT (D) (n = 5–7/experiment). Open bars denote LFD-fed mice, whereas solid bars denote HFD-fed mice. Data are expressed as means ± SE *P < 0.05 compared with LFD group. AUC, area under the curve; Bsl, basal; eWAT, epididymal white adipose tissue; GTT, glucose tolerance test; Ins, insulin-stimulated; iWAT, inguinal white adipose; t, total.

