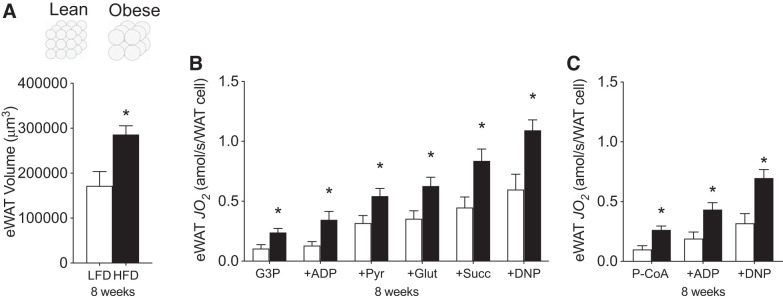
Fig. 6.
Mitochondrial respiration relative to changes in cell volume induced by HFD-feeding at 8 wk in eWAT. Adipocyte cell volume (A), carbohydrate-supported (B), and lipid-supported (C) mitochondrial respiration in eWAT (n = 4–6/experiment). Open bars denote LFD-fed mice, whereas solid bars denote HFD-fed mice. Data are expressed as means ± SE. *P < 0.05 compared with LFD group. DNP, 2,4-dinitrophenol; eWAT, epididymal white adipose tissue; Glut, glutamate; G3P, glycerol-3-phosphate; JO2, oxygen flux; P-CoA, palmitoyl-CoA; Pyr, pyruvate; Succ, succinate.

