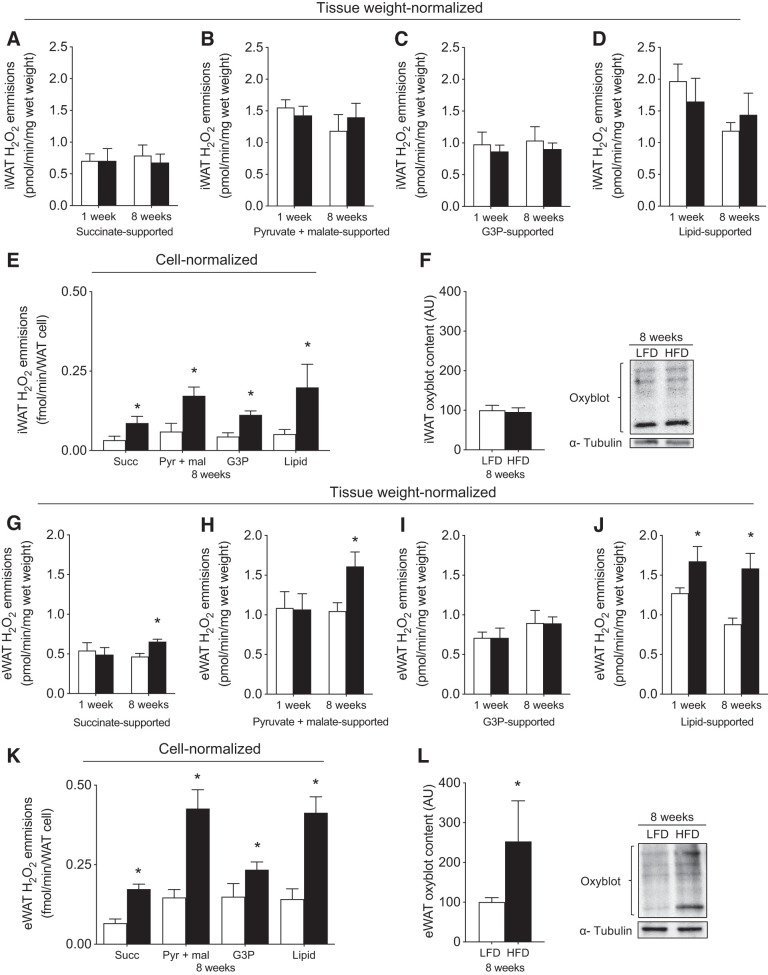
Fig. 7.
Mitochondrial reactive oxygen species (mtROS) emission and oxidative stress in iWAT and eWAT. In iWAT (top) and eWAT (bottom): tissue weight-normalized carbohydrate-supported (A–C, G–I) and lipid-supported (D, J) and cell-normalized (E, K) mtROS emission and protein carbonylation (F, L) (n = 5–8/experiment for mtROS, n = 6–10/experiment for oxyblot). Open bars denote LFD-fed mice, whereas solid bars denote HFD-fed mice. Data are expressed as means ± SE. *P < 0.05 compared with LFD group. AU, arbitrary units/µg protein; DNP, 2,4-dinitrophenol; eWAT, epididymal white adipose tissue; iWAT, inguinal white adipose tissue; Glut, glutamate; G3P, glycerol-3-phosphate; H2O2, hydrogen peroxide; P-CoA, palmitoyl-CoA; Pyr, pyruvate; Succ, succinate.

