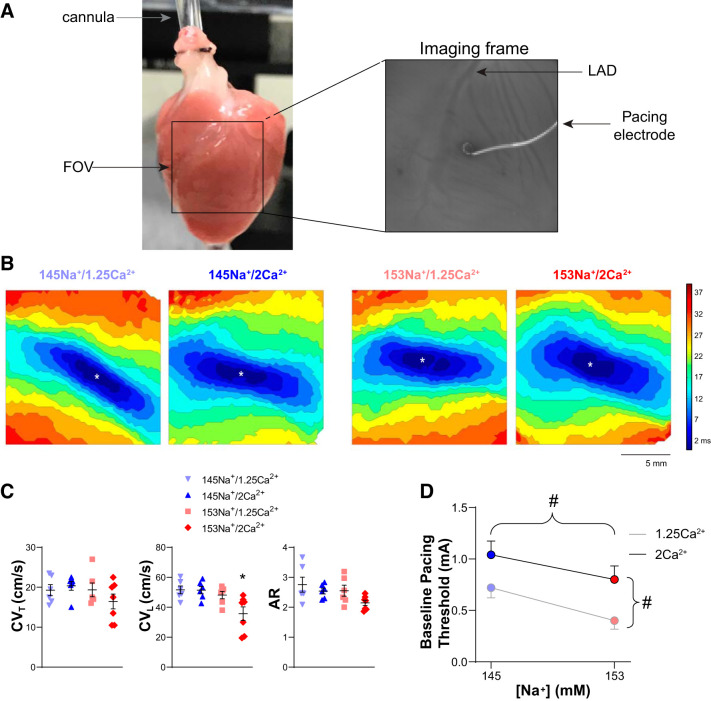
Fig. 1.
At baseline, changes in perfusate [Na+] and [Ca2+] significantly modulate excitability but have a minimal effect on conduction. A, left: image of a Langendorff-perfused guinea pig heart with the black box representing the field of view (FOV). A, right: representative imaging frame of the anterior ventricular epicardium (LAD, left anterior descending coronary artery), with pacing electrode in the center of the FOV. B: representative isochrone maps of action potential activation times with pacing (*site of pacing) during baseline conditions for each perfusate composition. Isochrones represent ∆3 ms, scale bar = 5 mm. C: summary data for baseline transverse conduction velocity (CVT; ANOVA, P = 0.33; left), longitudinal conduction velocity (CVL; *P < 0.05 vs. 145Na+/1.25Ca2+; middle), and anisotropy ratio (AR; ANOVA, P = 0.08; right); data present as individual values with means ± SE. D: summary data for baseline pacing threshold (#P < 0.05 by 2-way ANOVA; means ± SE); n = 6, 6, 6, and 7 for 145Na+/1.25Ca2+, 145Na+/2Ca2+, 153Na+/1.25Ca2+, and 153Na+/2Ca2+, respectively.

