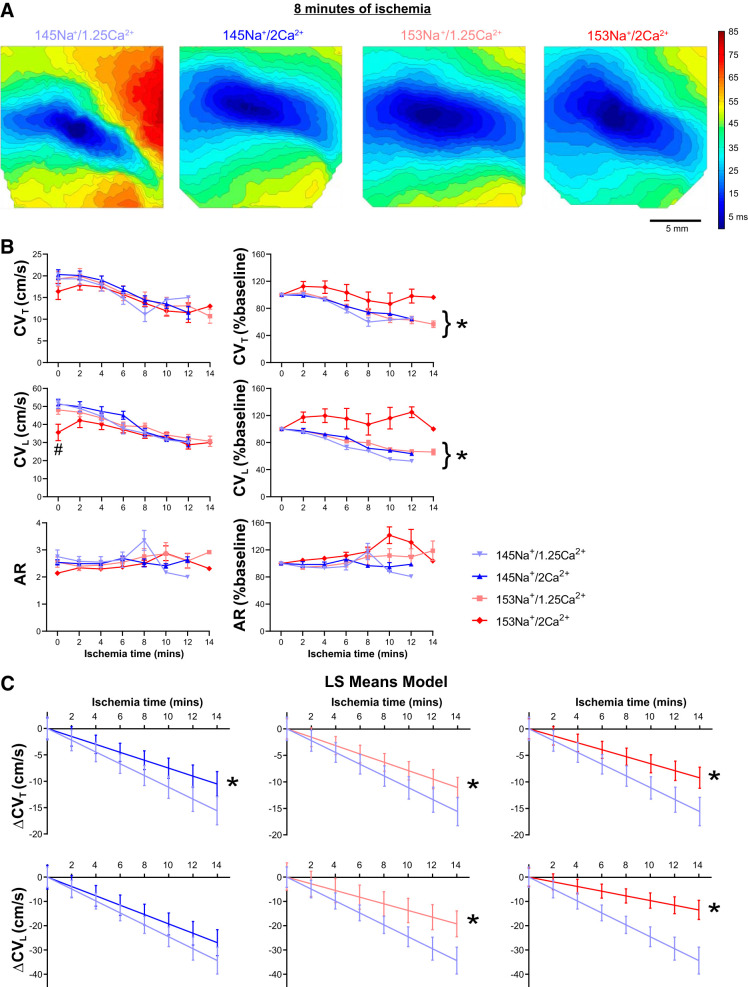
Fig. 4.
Increased [Na+] and [Ca2+] selectively preserves conduction during acute no-flow ischemia. A: representative isochrone maps of action potential activation time at 8 min of ischemia (before the onset of conduction block) demonstrating conduction differences between the perfusates tested. Isochrones represent ∆3 ms; scale bar = 5 mm. B: summary data (n = 6, 6, 6, and 7 for 145Na+/1.25Ca2+, 145Na+/2Ca2+, 153Na+/1.25Ca2+, and 153Na+/2Ca2+, respectively) for transverse CV (CVT, top), longitudinal CV (CVL, middle), and anisotropy ratio (AR, bottom); summary data are presented as means ± SE (left, #P < 0.05 vs. 145Na+/1.25Ca2+ at the indicated time point), and as a percent change of baseline (right; simple linear regression testing for a time-dependent CV change, *P < 0.01). C: least squares means (LS Means) model of CVT (top) and CVL (bottom) slowing during ischemia (presented as estimated value with 95% confidence interval); *adjusted P < 0.05 for slope vs. 145Na+/1.25Ca2+.

