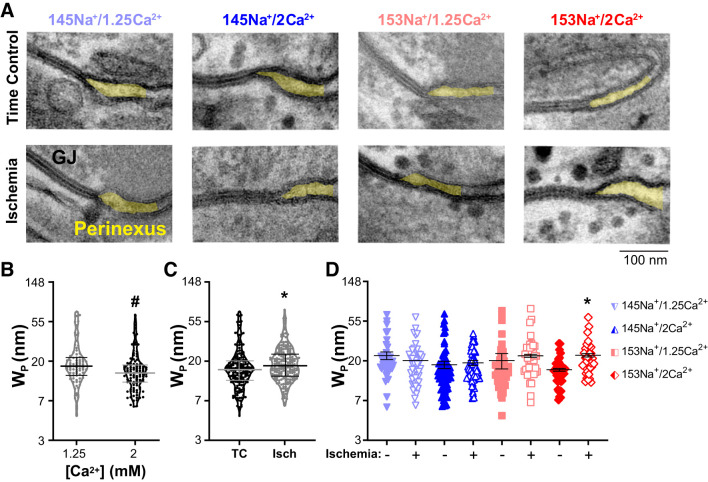
Fig. 6.
Increased [Na+] and [Ca2+] is associated with perinexal expansion during acute no-flow ischemia. A: representative transmission electron micrographs of the gap junction-adjacent perinexus nanodomain (shaded yellow) for each perfusate under nonischemic (time control) and ischemic conditions. The images demonstrate perinexal expansion [increased perinexal width (Wp)] induced by 10 min of no-flow ischemia in hearts perfused with 153Na+/2Ca2+; scale bar = 100 nm. Differences in Wp were evaluated using a mixed-effects linear model (B–D); note: y-axes plotted on natural log scale for transformed data (see methods). B: violin plots of individual data points and summary data (means ± SE) for Wp in nonischemic time controls as a function of [Ca2+] (n = 6 hearts each, ≥15 perinexal images per heart). Main effect for [Ca2+] demonstrating that mean Wp decreased in perfusates containing 2 vs. 1.25 mM [Ca2+] (black data points with gray bars vs. gray data points with black bars, respectively; *P < 0.01). C: violin plots of individual data points with summary data (means ± SE) for Wp at 10 min of ischemia (Isch, gray data points with black bars) or nonischemic time control (TC, black data points with gray bars) (n = 6 hearts each, ≥15 perinexal images per heart). For all perfusate groups combined, mean Wp was greater in Isch vs. TC, *P < 0.05. D: individual data points and summary data (means ± SE) for WP by individual perfusate composition (n = 3 hearts for each perfusate and condition, ≥15 perinexal images per heart). For individual perfusates, perinexal expansion was only significant for 153Na+/2Ca2+ (*P < 0.05 vs. nonischemic time control by Tukey’s honestly significant difference test).

