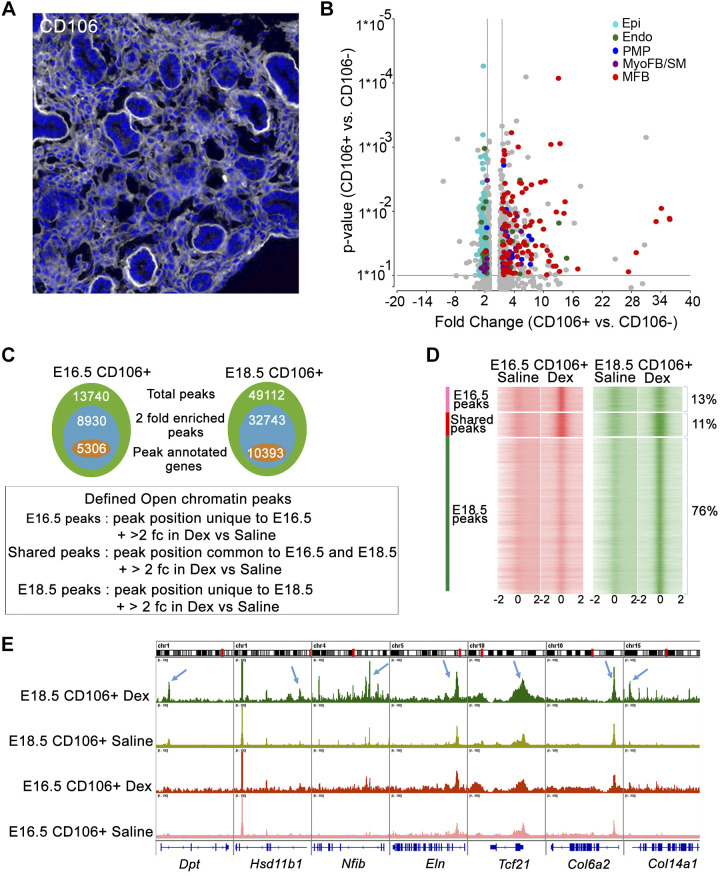
Fig. 4.
Glucocorticoid receptor (GR) activation alters chromatin accessibility in lung matrix fibroblast at embryonic day (E)18.5 A: a subset of lung fibroblasts, matrix fibroblasts (MFBs), were identified by CD106 staining at E16.5 in wild-type mice. Representative image from n = 4 mice analyzed. B: CD106+ cells were isolated from E16.5 control lungs after immune and endothelial cell depletion (CD45/31/144/309) and positive CD106 selection (yield ~1.5 × 10⁻⁵ cells per lung). RNA-seq analysis of CD106+ vs CD106− cells (n = 2 isolations/group) demonstrated increased expression of MFB-signature genes in CD106+ cells compared with proliferative mesenchymal progenitor cell (PMP) and myofibroblast (MyoFB). SM, smooth muscle. Volcano plot shows signature genes from PMP (indigo), MyoFB (violet), MFB (red), endothelial (Endo; green), and epithelial (Epi; blue) that were induced more than 1.5-fold in CD106+ cells. Gray color represents genes that were not cell type specific. C: CD106+ cells were isolated from normal mouse fetal lungs at E16.5 (n = 4) and E18.5 (n = 4). Pooled cells were split equally and treated with 100 nM dexamethasone (Dex) or saline for 4 h in vitro and subjected to ATAC-seq. Venn diagrams represent the statistics summary of ATAC-seq peaks detected in CD106+ cells. Total peaks (green), 2-fold enriched peaks by Dex (blue) and 2-fold enriched peaks with annotated genes (orange); 2 fc: 2-fold change. D: ATAC peaks (open chromatin regions) that were unique to E16.5 or E18.5 or shared between each time point in Dex-treated CD106+ cells were identified by MergePeak analysis in Homer. Heatmap displays read density surrounding unique and shared peaks. Open chromatin states (midpoint ± 2 kb of the open region) were identified from saline and Dex-treated CD106+ cells at E16.5 and E18.5, respectively. As shown, 76% of detected open chromatin peaks are unique to Dex-treated CD106+ cells at E18.5. 13% are unique to E16.5 and 11% are shared between 2 times. ATAC-seq analysis is consistent with RNA expression data showing that GC/GR signaling is most active in CD106+ matrix fibroblast cells at E18.5. E: Integrative Genome Viewer (IGV) view shows ATAC-seq peaks for a subset of MFB signature genes in saline and Dex-treated CD106+ cells at E16.5 and E18.5. Blue arrows indicate ATAC-seq peaks induced by Dex near the promoter regions of representative MFB signature genes. Results demonstrated increased chromatin accessibility near loci associated with MFB signature genes by dexamethasone treatment of CD106+ cells at E18.5.

