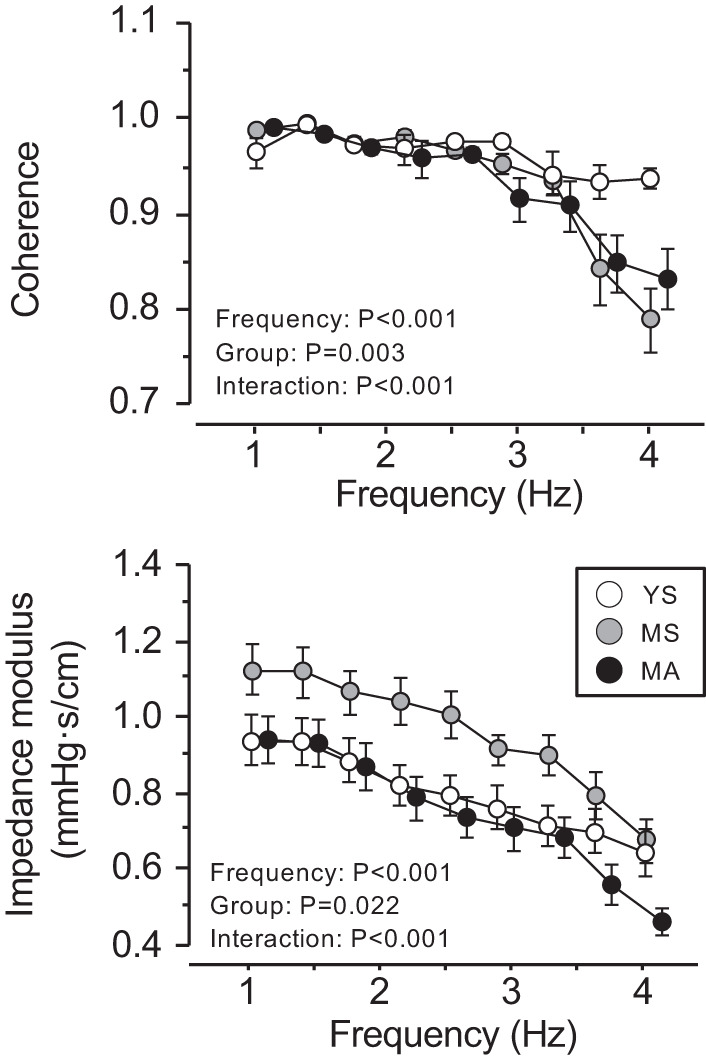
Fig. 2.

Group-averaged frequency plots of cerebrovascular impedance modulus and coherence. Data are means ± SE. YS, MS, and MA indicate young sedentary (10 men, 11 women), middle-aged sedentary (11 men, 10 women), and masters athletes (11 men, 10 women), respectively.
