
Fig. 3.
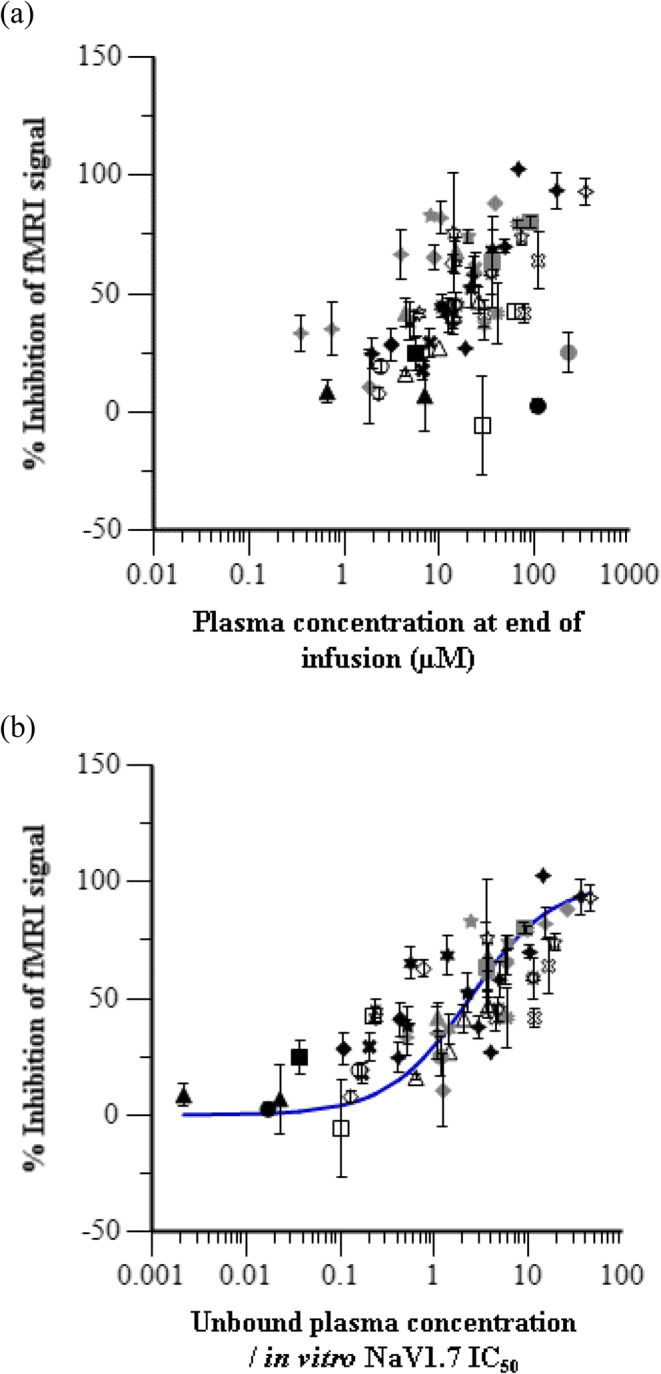
Pooled compound exposure-response in rhesus olfaction assay. Average inhibition of fMRI signal during the infusion interval at each dose level versus (a) the average total plasma concentration and (b) the average unbound plasma concentration normalized by in vitro IC50 for each test compound. Symbols represent observed data and error bars indicate standard error of the mean. The line is an overlay of the fitted model prediction.