
Fig. 4.
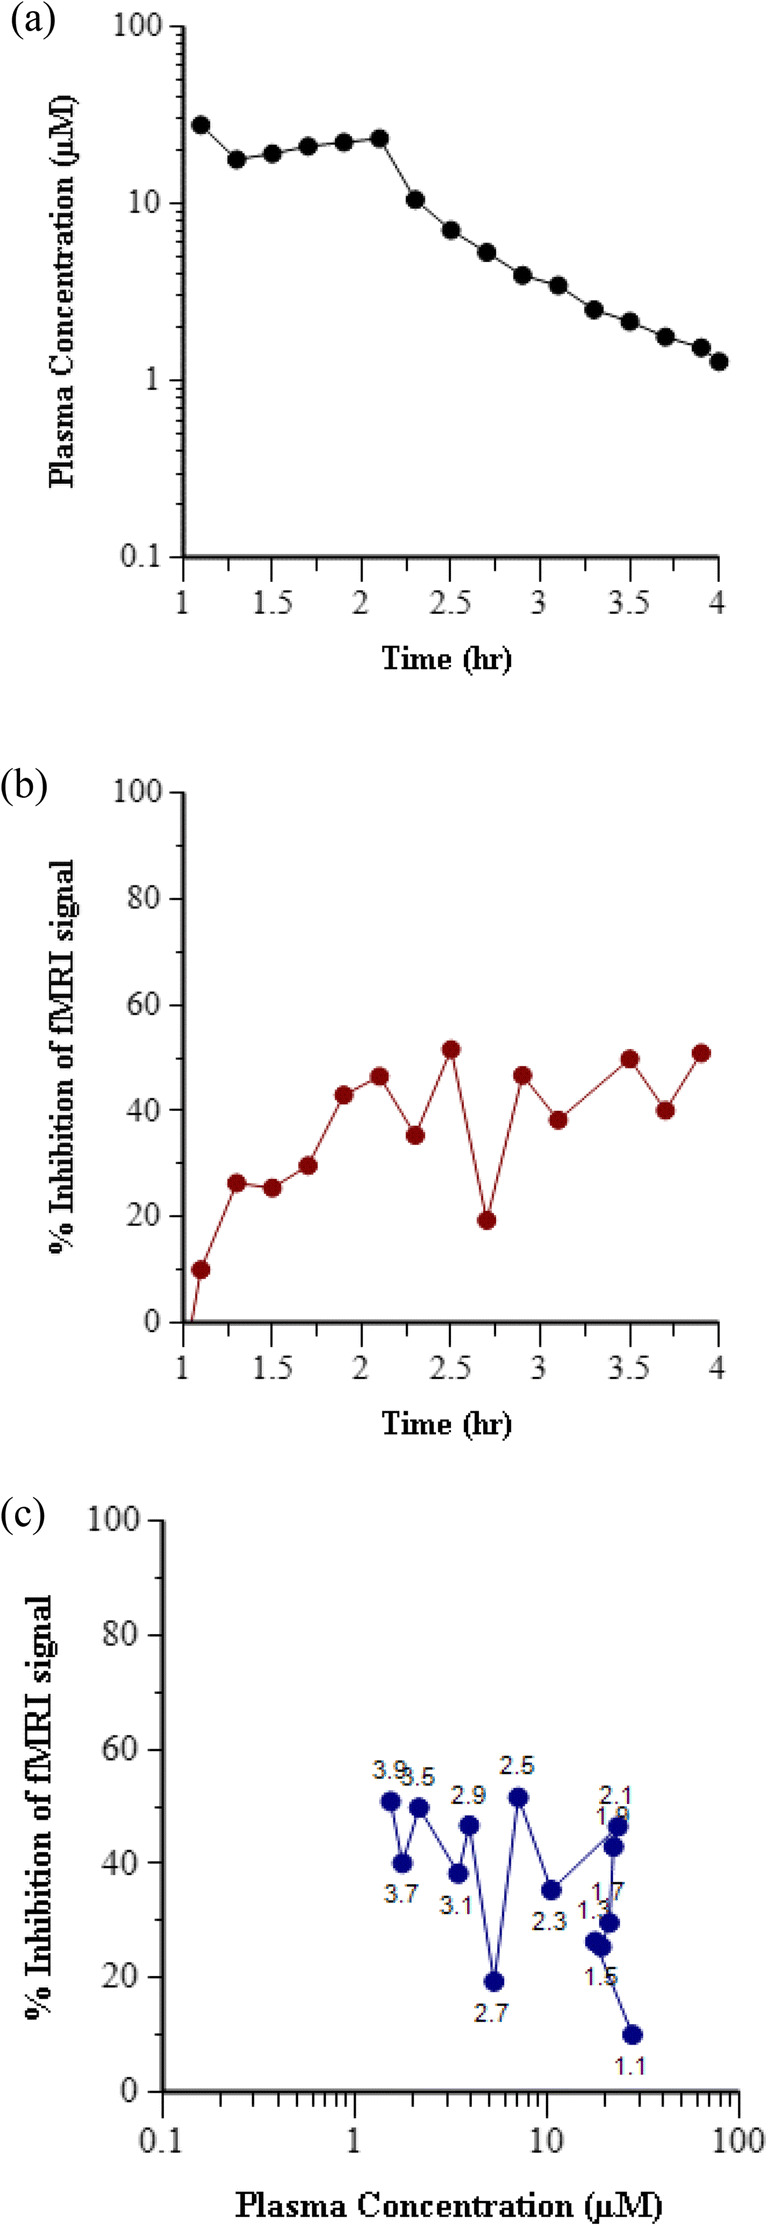
Temporal delay in effect relative to exposure in rhesus olfaction assay for representative Compound 6. (a) Time course of Compound 6 concentration in plasma following IV bolus plus 1 h infusion at a dose of 5 mg/kg in rhesus. (b) Time course of inhibition of fMRI signal following IV bolus plus 1 h infusion of 5 mg/kg Compound 6. (c) Hysteresis loop in the plot of inhibition of fMRI signal versus Compound 6 concentration in plasma at each time point. Data labels indicate the time in hours after start of fMRI data acquisition.