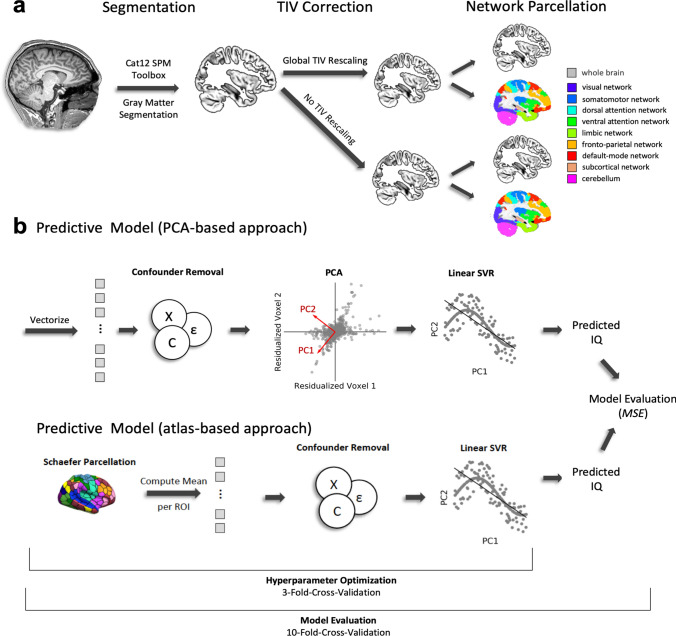
Fig. 1.
Schematic illustration of processing steps and analysis workflow. a Preprocessing of structural MRI data. T1-weighted MR images were segmented using the CAT12 SPM toolbox to generate individual gray matter volume maps, which were then corrected and rescaled for between-person variations in total intracranial volume (TIV, see “Methods” for further details). The TIV-rescaled gray matter volume maps (representing relative gray matter volume) and the raw gray matter volume maps (uncorrected for TIV, representing absolute gray matter volume) were used to establish a global (whole-brain) prediction model. In addition, all maps were parcellated into the seven established functional brain networks (derived from Yeo et al. 2011). A subcortical network and the cerebellum were added in the PCA-based approach only. Together with the whole-brain model, this resulted in ten analyses for the TIV-rescaled (relative) and ten analyses for the non-rescaled (absolute) regional gray matter volume data for the PCA-based approach. In respect to the atlas-based approach, this resulted in eight analyses for relative and eight analyses for absolute gray matter data. b In these analyses, the vectorized data were fed to our predictive model. In the PCA-based approach, the first step consisted of removing confounder variables (age, sex, handedness) from every voxel using linear regression. Then a full variance decomposition (PCA) was performed on the residualized data. The resulting principal components were then used as input for a linear SVR to predict the IQ score of individual subjects. In the atlas-based approach, the data were at first parcellated into 400 parcels in accordance with the Schaefer atlas (Schaefer et al. 2018), then gray matter values were averaged within each parcel, and lastly, residualized in respect to the control variables. The resulting averaged gray matter volume values were fed into a linear SVR and predicted IQ scores were computed. Importantly, the hyperparameters of the SVR were optimized using a threefold cross-validation which was nested inside a tenfold cross-validation scheme to evaluate the final model performance with mean squared error as a primary model evaluation criterion (see also Supplementary Figure S1 for a more detailed visualization). TIV total intracranial volume, PCA principal component analysis, PC principal component, SVR support vector regression, IQ intelligence quotient, MSE mean squared error

