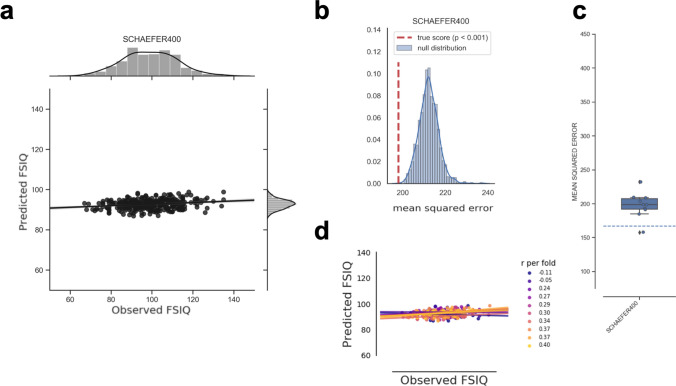
Fig. 4.
Predictive performance of the global model based on relative (i.e., TIV-rescaled) gray matter volume and the atlas-based feature construction approach. a Observed (x-axis) versus predicted (y-axis) Full-Scale Intelligence Quotient (FSIQ) scores for all 308 participants. The gray area around the regression line represents the 95% confidence interval (determined by bootstrapping) of prediction accuracy. Note that to allow the same scaling of y-axes as in the local models (Fig. 6), one data point was removed only for illustration. b Results of the non-parametric permutation test. The histogram shows the predictive performance given surrogate-null data, i.e., the distribution of the test statistic (mean squared error, MSE) based on permuted data (N = 1,000 permutations; blue line: KDE smoothing) in relation to the predictive performance (MSE) based on the observed (non-permuted) data (red vertical line). If the MSE of the observed data had occurred in the extreme tails of the surrogate/permuted data, the prediction result from the machine learning pipeline would have been highly unlikely to be generated by chance, and thus considered significant. The p value resulted from summing up the times in which model performance based on the true targets was lower than model performance based on the permuted targets and dividing this number by the number of permutations. Thus, p values correspond to the percentile position of the observed MSE in the distribution of surrogate-null values. c Boxplot illustrating the variability of predictive performance (MSE) across folds. The boxes represent the interquartile range, horizontal lines represent the median, and the whiskers extend to points that lie within 1.5 times the interquartile ranges. The dotted line illustrates the performance of a ‘dummy model’ predicting the group-mean IQ of the training sample for every subject of the test sample. d Fold-wise illustration of the correlation between observed versus predicted FSIQ scores for all 308 participants. Predictions of each cross-validation fold and the corresponding approximated linear regression slopes are highlighted in different colors. FSIQ Full-Scale Intelligence Quotient, r Pearson’s correlation coefficient between predicted and observed FSIQ score

