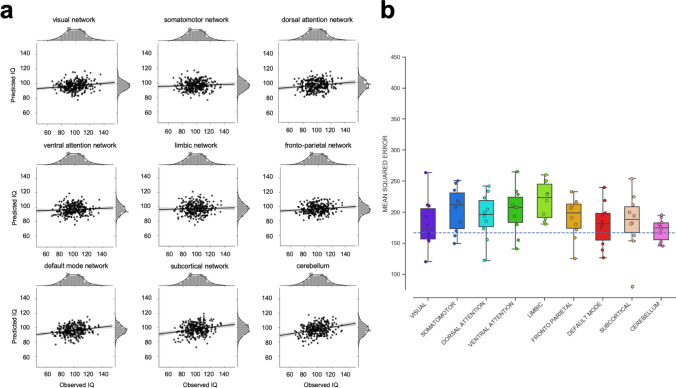
Fig. 5.
Predictive performance of nine local models based on relative (i.e., TIV-rescaled) gray matter volume and the PCA-based feature construction approach. The nine local models represent the functionally defined brain networks depicted in Fig. 2 (see also “Methods” for further details). a Observed (x-axis) versus predicted (y-axis) FSIQ scores for all 308 participants, separately for each functional network. The gray areas around the regression lines represent the 95%-confidence intervals (determined by bootstrapping) of prediction accuracies. b Boxplots illustrating the variability of predictive performance (mean squared error, MSE) across cross-validation folds. The boxes represent the interquartile range, horizontal lines represent the median, and the whiskers extend to points that lie within 1.5 times the interquartile ranges. The dotted line illustrates the performance of a ‘dummy model’ predicting the group-mean IQ of the training sample for every subject of the test sample

