
Fig. 2. Global ocean-atmosphere CO2 fluxes 1992–2018.
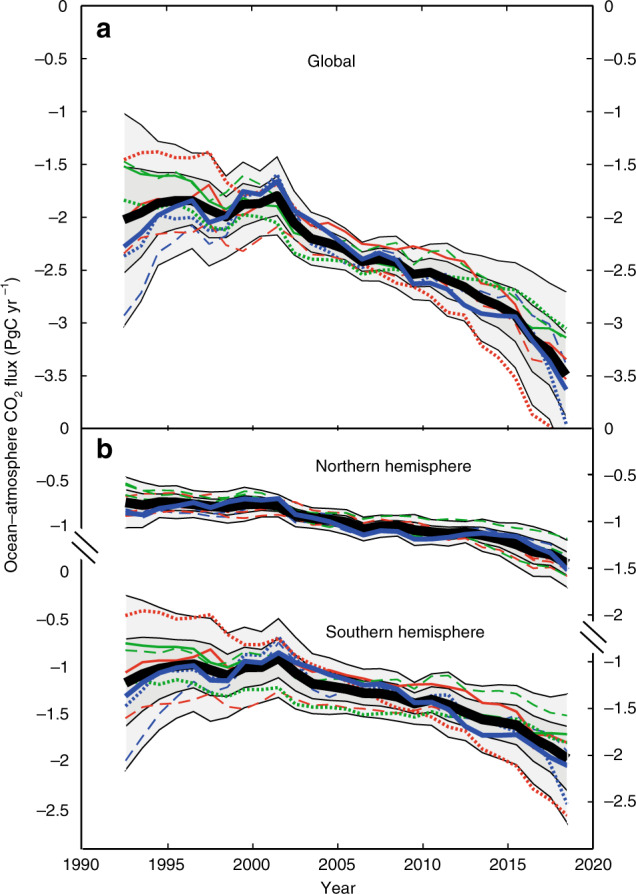
Fluxes are integrated a globally, and b for northern and southern hemispheres, calculated using a standard gas exchange formulation (see Methods section) with the nine interpolation schemes for fCO2 described in the text shown as colored lines: TS red, MLR green, FFN blue. The line styles indicate the spatial clustering schemes used (illustrated in Supplementary Fig. 1): solid, Landschützer SOM; dashed, latitudinal regions; dotted, Fay and Mckinley biomes. The standard method, SOM-FFN as described in Landschützer et al.8, is shown as a thicker blue line. Shading indicates one- and two-standard deviations of the nine methods around the mean (thick black line).