Figure 4.
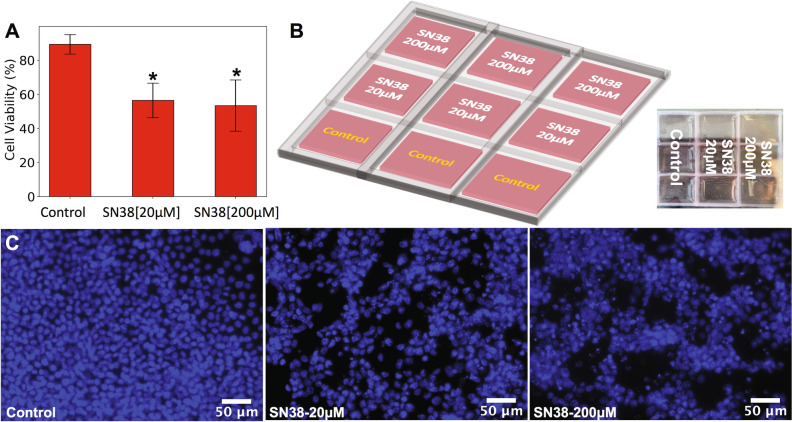
(A) Bar plot showing the cell viability within 2D-constructs after 48 h of drug treatment. The control cell populations showed a viability of 90%, cell populations treated with 20 µM of SN38 showed a viability of 57%, and cell populations treated with 200 µM of SN38 showed a viability of 48% after 48 h. (B) Schematic and image of 3D-printed PDMS well arrays with HCT 116 cultured cells. A total of three rows of wells were used, where one row (consisting of three replicate wells) was designated as a control population (no drug), a second row consisted of HCT116 cell population treated with 20 µM of SN38, and a third row consisted of HCT116 cell population treated with 200 µM of SN38. (C) Fluorescent image representatives of NucBlue stained HCT116 cells for control population (left), HCT116 cells with 20 µM of SN38 (middle), and HCT116 cells with 200 µM of SN38 (right) are shown, where control population shows a more cohesive adhered monolayer, while those treated with SN-38 presented significant loss of monolayer distribution with large sparse gaps. One-way ANOVA indicated that statistical significance of *p < 0.0001 for both treated populations (20 and 200 µM of SN38) compared to control population.

